
Managing the Invisible - How the Pareto Principle Helps Control the Iceberg Beneath the Surface
The 80-20 Rule in Project Management and Product Development
The Pareto Principle, also known as the 80-20 rule, is a powerful tool for working efficiently – when applied correctly. It states that 80% of the results can be achieved with only 20% of the effort, while 80% of the resources must be expended to achieve the remaining 20% of the results. This imbalance between effort and return can be seen in many areas and has significant benefits, particularly in project management and product development.
How many times have teams thought they were in the home stretch of a project, only to find that the real work was just beginning? The Pareto method helps to optimize the use of resources and identify risks at an early stage by setting specific priorities. Pareto charts can be used to visualize these relationships and make them useful for strategic decisions. A great tool for any project meeting!
Basics of the Pareto Principle
Origin and Definition
The Pareto principle, named after its developer, the Italian economist and sociologist Vilfredo Pareto, dates back to his interesting observation in 1906 that around 80% of the national wealth in Italy was owned by just 20% of the population. Upon further investigation, Pareto discovered that this unequal ratio was also evident in other European countries.
The Pareto method describes the relationship between effort and result, or input and output. Its core principle states that 80% of an outcome can be achieved with only 20% of the contributing factors. In other words, 80% of the desired result can be achieved with 20% of the total effort, while the remaining 20% of the result requires the remaining 80%. Ignoring this relationship in project management can be fatal.
Importance and Prevalence
In 1937, American economic theorist Joseph Juran discovered Pareto’s research and renamed the 80/20 rule “Pareto’s principle of unequal distribution.” Juran applied this principle to the business world, focusing on the idea that companies can positively influence a large part of their operations by focusing on the “vital few” (the important 20%).
While the exact 80/20 ratio does not always apply, the underlying principle is useful for defining, documenting, and presenting priorities. It helps us focus on the tasks with the greatest impact, thereby increasing productivity and efficiency.
Applications in Project Management
Increased Efficiency through Prioritization
The Pareto principle is helpful in project management because it significantly reduces planning and implementation risks through targeted prioritization. Project managers can more realistically plan and assess project statuses if they understand which tasks account for only 20% of the time yet deliver 80% of the results. For example, if project results need to be visible to a customer as early as possible, these tasks could be prioritized. However, allocating adequate resources to the remaining 80% of tasks is more important so as not to disrupt the schedule.
In project planning, this principle means effort and results are not directly proportional. Therefore, projects should be planned and evaluated based on the effort required rather than their expected results.
Resource optimization and Time Management
The Pareto principle is particularly evident in project management, especially with regard to time management.
Perhaps you are familiar with the following scenario: You want to renovate a room in your home. First, you need to remove the old wallpaper. You start by soaking it, then peeling off the strips. After an hour, most of it is gone. You are well on schedule and might even finish today. All that’s left is to remove the residue in the corners and above the window, but by then, the day is over. Does this sound familiar from your projects?
The Pareto principle applies here, too: 80% of productive work can be done in just 20% of the available time. This insight can be used to optimize workflows, especially when work steps must be carried out sequentially. This creates time slots in which certain tasks can be completed in a focused manner. Those who evaluate their projects based on gut feeling often experience an unpleasant surprise when they think they are on the home stretch.
The 80-20 principle is applied by project managers so that requirements and tasks can be prioritized and they aren’t bogged down in the nitty-gritty details. This leads to a more efficient use of resources and better consideration of the circumstances. Human resources are allocated according to the workload, ensuring that no one is overburdened. The performance of individual employees is evaluated more fairly, which ultimately leads to greater team satisfaction. When everyone is fully committed to a plan, it gives everyone a sense of security because it shows that the situation is under control.
Applications in Product Development
Customer Focus and Market Analysis
In product development, the Pareto Principle plays a critical role in focusing on customer needs. The realization that 20% of customers typically generate 80% of a company’s revenue has important strategic implications. Product developers can focus their resources on the needs of this important group of customers to achieve the greatest economic benefit.
However, this does not mean that the remaining 80% of customers should be ignored, but rather that the needs of the core target group must be met before further resources are allocated to special needs.
Quality management and error reduction
In quality management, the Pareto Principle states that 20% of the causes of defects are responsible for 80% of the defects that occur. By identifying and eliminating these critical sources of error, product quality can be significantly improved without having to address all potential sources of error immediately.
This insight is especially valuable during product development, when limited quality assurance resources must be maximized. Development teams can focus on fixing the most common and serious problems to quickly achieve high baseline quality.
Implement the Pareto Principle: A Set of Rules
Identification of the Vital Few
Successful application of the Pareto Principle begins with correctly identifying the “critical few”-the 20% of factors that account for 80% of the results. The following steps can help:
- Data Collection: Collect relevant data about your activities, customers, or problems. Since you are extracting information from the data, continuous collection is a must.
- Categorize: Group similar items together to get a clearer picture. Relationships can be complex. Use relational databases to efficiently capture as many of these relationships as possible.
- Root cause analysis: Perform a detailed analysis of key problem areas to identify and understand the underlying causes.
- Quantitative analysis: Determine the contribution of each element to the overall outcome. Standardize the collection of information so that these analyses can be performed automatically.
- Prioritize: Identify the elements that have the greatest impact. Create consistent models for planning and evaluation across the enterprise.
Implementation Rules for Project Managers
To successfully implement the Pareto Principle in project management, the following rules are recommended:
- Focus on core objectives: Focus on the 20% of tasks that contribute 80% to project success – focus on project success.
- Delegate non-essential tasks: Less important tasks should be delegated or prioritized differently.
- Review regularly: Continually analyze whether your team is working on the right priorities.
- Adjust resources: Adjust resource allocation according to the 80-20 split.
- Communicate priorities: Ensure that all team members understand the key priorities that have been established.
- Accept imperfection: Recognize that perfection in any area is inefficient-or, in the words of French philosopher François-Marie Arouet: “L’ennemi du bien est le bien” (Perfect is the enemy of good).
Avoiding typical Pitfalls
When applying the Pareto Principle, the following common mistakes should be avoided:
- Oversimplification: The exact ratio of 80-20 is only a guideline, not an ironclad rule. Ratios of 70-30 or 90-10 can also occur. It is important to be aware of this shift.
- Neglect the “unimportant” 80%: Even if you focus on the most important 20%, do not completely ignore the other 80%. Otherwise, you will accumulate debt, have incomplete risk coverage, or dissatisfied stakeholders.
- Static view: The important 20% – the “vital few” – is not a fixed quantity. Its content can change over time and should be reassessed regularly.
- Lack of data: “Without data, you’re just someone with an opinion” (W. Edwards Deming). Identifying the important 20% should be based on solid data, not gut feeling.
- Resistance to change: Implementing the Pareto Principle often requires a change in the way things are done. It is a project that can only be successfully implemented as a team.
The Pareto-Chart
Definition and Structure
A Pareto chart is a visual tool for illustrating the Pareto principle. It combines elements of bar and line charts: individual values are represented by bars in descending order. A cumulative line is added to show the percentage of the total.
This type of presentation makes it immediately clear which factors have the greatest influence and helps distinguish the “vital few” from the “trivial many”.
How to Create and Interpret
A Pareto chart is created in several steps:
- Collect data: Collect data relevant to the problem or issue being analyzed.
- Categorize: Organize the data into meaningful categories.
- Calculate frequency: Calculate the frequency or value of each category.
- Sort: Arrange categories in descending order of frequency or value.
- Create a chart: Create a bar chart, for example, for “Sales” by “Subcategory” in descending order.
- Add a cumulative line: Add a row that displays the cumulative percentages.
When interpreting a Pareto chart, pay special attention to the point where the cumulative line crosses the 80% mark. The categories shown up to this point together account for about 80% of the total effect and therefore deserve special attention.
The following figure shows such a graph based on a generalized defect size analysis. For each root cause, the number of defects in the device for which that root cause was identified was determined (left axis of the coordinate system). In our example, the root cause with ID 6 was identified in almost 70 defects. The error frequency bars are then arranged in the diagram from left to right in descending order according to their size or frequency. The sum of all bars represents the total number of defects, i.e. 100% or 1 (right coordinate axis).
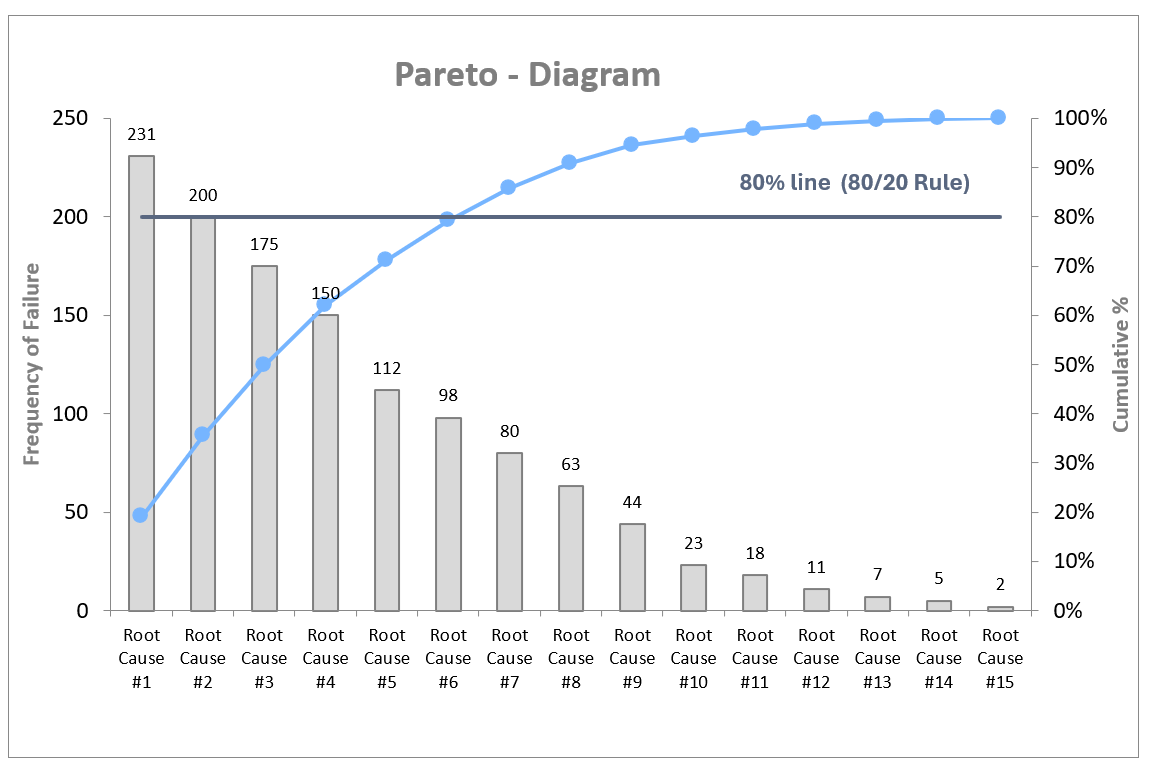
Now, starting from the left, the percentages of the error frequency are added to produce the curve shown in blue. Above the last bar on the right is the value 100% or 1. The point where the curve intersects the 80% mark indicates the root causes that contribute to 80% of the device failures. In this particular case, it is six out of 15 (40 percent). This means that in this specific example, 40% of all known causes are responsible for 80% of the failures. It should be noted that only the failure frequency was considered, not the criticality. Therefore, to achieve a significant improvement in the equipment, you must focus on eliminating these six root causes.
Practical application examples
Another concrete example of using the Pareto chart is inventory management using the ABC method in logistics. This method assumes that 20% of the parts in stock generate 80% of the sales, 30% of the parts generate 15%, and 50% of the parts generate 5%. A Pareto chart can be used to visualize these relationships and prioritize inventory and procurement.
In quality management, the Pareto chart is used to identify the most common causes of defects. This is similar to the example described in the previous section. If 20% of the causes of defects are responsible for 80% of the defects, quality improvement efforts can be focused on these main causes. This leads to efficient troubleshooting.
Conclusion: The Power of Purposeful Focus
The Pareto Principle is a valuable approach to setting the right priorities in a complex world with limited resources. By focusing on the 20% of factors that produce 80% of the results, project managers and product developers can significantly increase their efficiency and achieve better results.
However, successful implementation of the Pareto Principle requires more than just knowledge of the 80-20 rule. It requires systematic data collection and analysis, a willingness to follow through on priorities, and the courage to put less important tasks on hold. Pareto charts can be used to visualize and communicate the relevant relationships, facilitating decision making.
At a time when efficiency and focus are increasingly important, the Pareto Principle offers a proven approach to achieving maximum impact with limited resources. The realization that not all tasks are equally important and that a wise choice of priorities can determine success or failure is one of the most valuable insights for modern project and product management.