
General Quality Methods
Introduction
General quality methods are proven tools for quality management that ensure product and process quality, both proactively and reactively. In medical technology, these methods can be integrated into various processes in the process landscape. Below, we present important general quality methods, explain their principles, list their pros and cons, and provide an example from medical technology. This will help you understand how these tools contribute to ensuring the quality of your products and processes.
Quality Function Deployment (QFD) – Implementing Customer Requirements
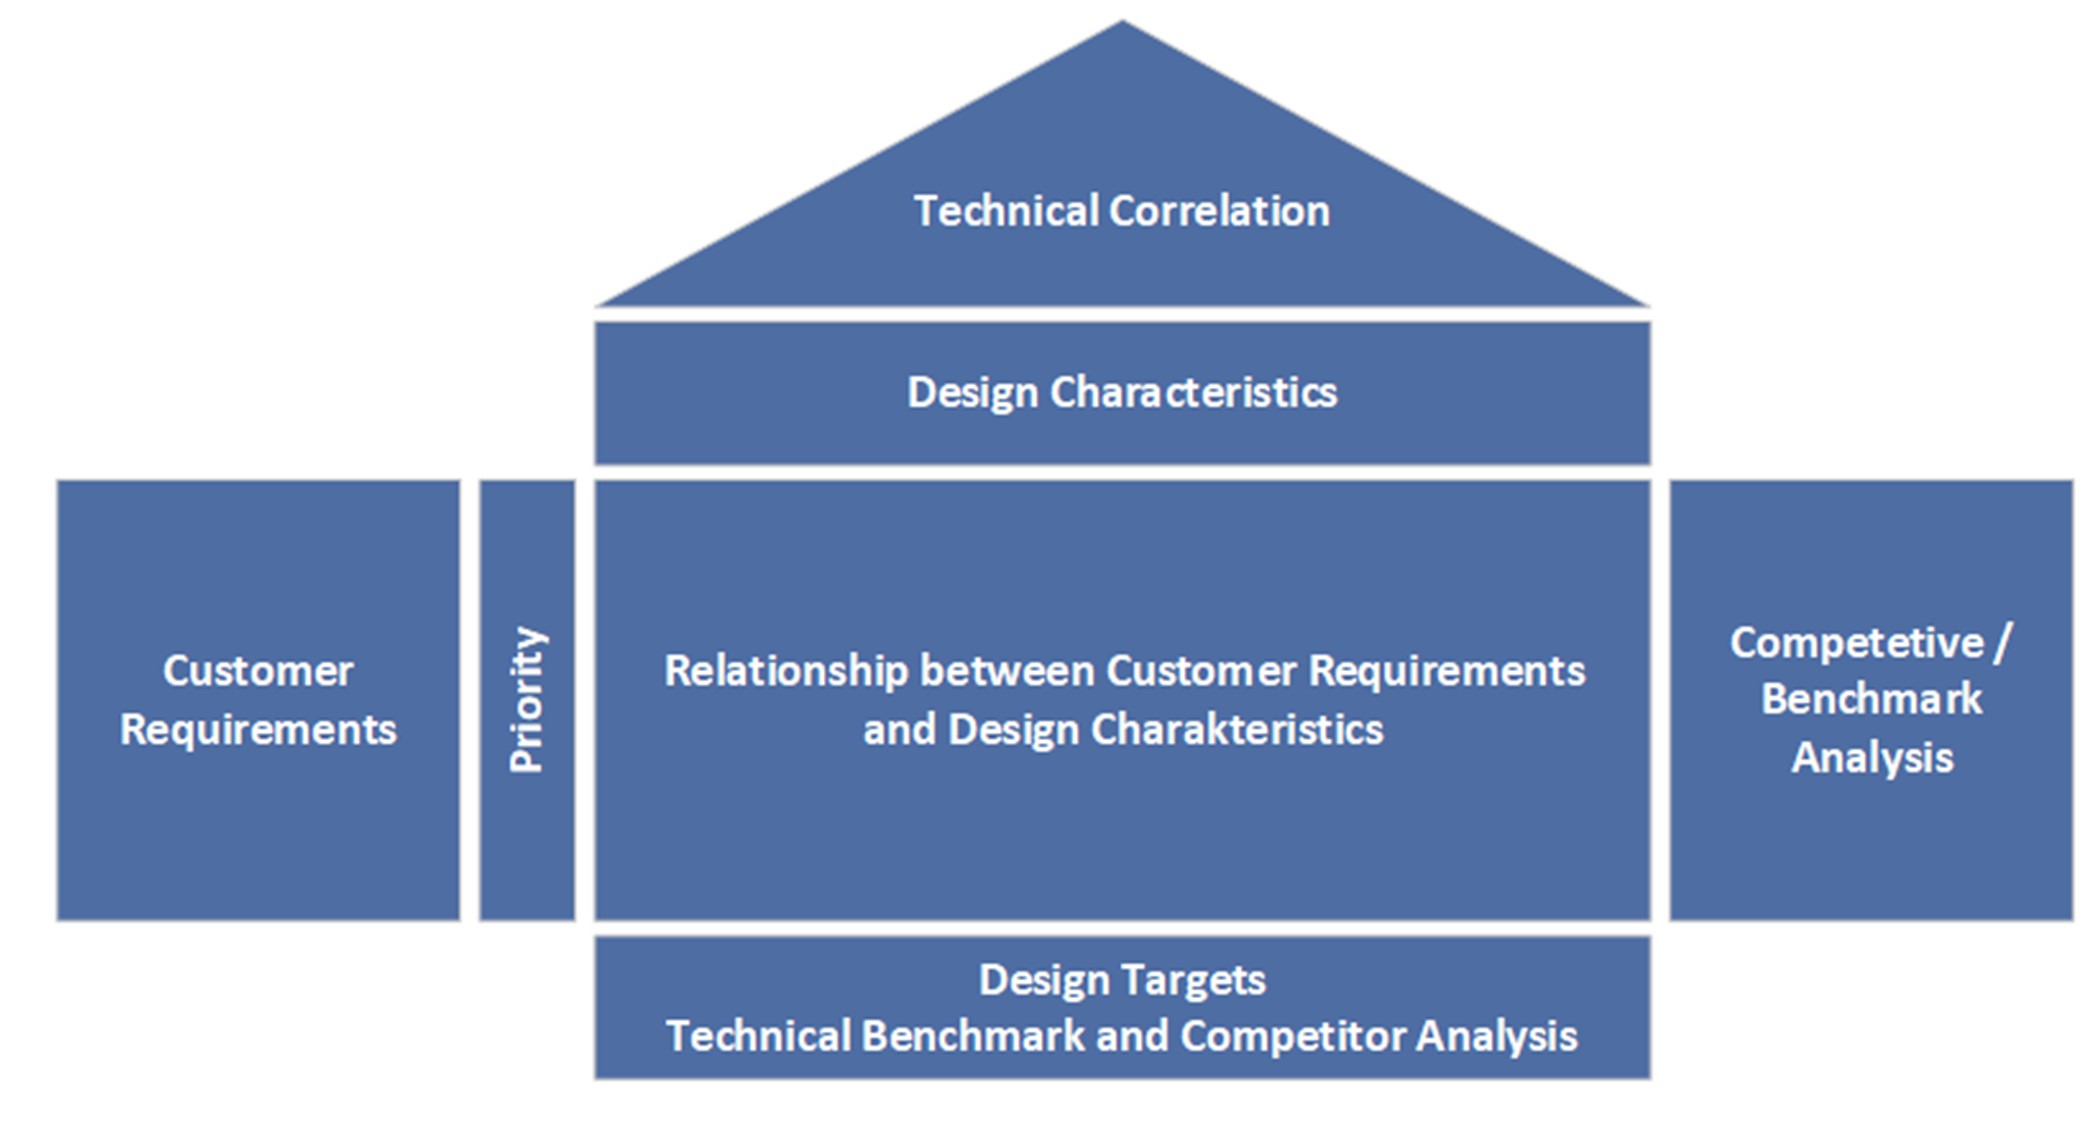
QFD is a method for systematically translating customer requirements into technical ones. It is used in the early phases of product development to create a robust requirements document. With QFD (“House of Quality”), you can collect customer feedback in a structured manner and ensure that development goals closely align with users’ and patients’ actual needs. This prevents important requirements from being overlooked. In medical technology, where user-friendliness, safety, and effectiveness are crucial, QFD is a valuable product development planning tool. QFD promotes cross-departmental collaboration between development, marketing, and production teams to ensure that the final product is both technically feasible and market-oriented.
Advantages:
- Early identification of relevant customer requirements: We systematically identify and prioritize the real needs of customers right from the concept phase. The result is products with greater customer benefits that are precisely tailored to user requirements.
- Cross-departmental coordination: QFD involves all relevant departments, such as development, production, and marketing, from the beginning. This leads to production-oriented designs, improves internal communication, and shortens development time. Changes later in the process are minimized, saving time and money.
- Documentation and traceability: Using the House of Quality results in a fully documented matrix that clarifies the decision criteria and requirements. This facilitates verification by auditors in the context of design controls according to ISO 13485.
Disadvantages/Limitations:
- Effort and complexity: Creating a House of Quality is time-consuming. For complex products with a large number of requirements, QFD can become extensive and cumbersome. Training and moderation are required to ensure your team uses the method efficiently.
- Data quality is crucial: QFD is only as good as the underlying customer information. Incomplete or incorrect customer input results in suboptimal priorities. Additionally, the team must collaborate across departments. Without acceptance, QFD can become a mere formality.
- Not every project requires QFD: For very simple products or those with a low degree of innovation, the benefits of QFD may not justify the effort.
Example (medical technology): A team of developers is designing a new insulin pump system. They use QFD to collect user requirements first, such as “easy handling for patients,” “reliable dosing accuracy,” and “easy data transfer to doctor software.” The customer requirements are then prioritized in the House of Quality and assigned to technical features, such as the user interface, dosing mechanism, and wireless module. The result is a specification sheet that ensures design decisions, such as display size, mechanics, and software functions, are consistently aligned with stakeholder needs. The end product is an insulin pump that impresses in clinical trials with its user-friendliness and safety because no important detail has been overlooked.
Failure Mode and Effects Analysis (FMEA) – Preventing Risks
FMEA (Failure Mode and Effects Analysis) is a preventive method in risk and quality management that has been around for many years. Its purpose is to identify potential errors in products or processes early on, analyze their causes and effects, and define suitable countermeasures. During product development (design FMEA) or process planning (process FMEA), you are systematically guided through the product or process, considering the following question for each function or step: “What could go wrong here if the product or component meets the requirements — or does not?” For each potential error type, you evaluate the probability of its occurrence, its potential impact, and the probability of its detection. The latter is not explicitly required by ISO 14971. The product of these factors is the risk priority number (RPN), which is used to prioritize where action is needed. FMEA is often used in medical technology as part of the risk management process according to ISO 14971 to meet safety and performance requirements. It is important to note that an FMEA should only be completed once the measures have been implemented to ensure that the identified risks have been eliminated or reduced as much as possible.
Advantages:
- Early Risk Detection: Identify potential errors and weaknesses during the development or planning phase before they occur in practice. This allows you to take preventive measures, such as design changes, tests, or process adjustments, reducing the need for costly changes or recalls later on.
- Structured, team-oriented analysis: FMEA promotes interdisciplinary teamwork. Various experts, such as developers, quality managers, clinicians, and manufacturing specialists, contribute their knowledge to ensure that all influencing factors are considered. Nothing is overlooked — the procedure is traceable and documented, which is important for audits.
- Prioritization of risks: RPZ assessments enable you to clearly identify and address the most critical risks in a targeted manner. This allows the team to focus on issues that are truly relevant to safety, directly benefiting patient safety in medical technology. Additionally, many customers and regulatory authorities require proof of risk assessment.
Disadvantages/Limitations:
- Time-consuming and resource-intensive: A thorough FMEA can be very extensive. For complex devices or processes, hundreds of possible failure modes may need to be analyzed. This requires a lot of time, disciplined moderation, and maintenance of the FMEA document.
- Subjectivity in assessments: The assessment of probability and detection rates is partly subjective. Different team members may arrive at different RPZs. Experience and, if necessary, company-wide criteria can help here, but the “accuracy” of FMEA is limited – they are a qualitative tool.
- Limited suitability for complex relationships: FMEA generally considers single causes of failure and their direct effects. In very complex scenarios where multiple factors must interact to cause damage (e.g., application error plus device malfunction plus environmental conditions), an FMEA can become confusing or fail to adequately represent the chain of events. In such cases, supplementary methods such as fault tree analysis (for combinations of causes) are useful.
- Maintenance effort: The FMEA must be updated after product changes or process adjustments. This ongoing maintenance effort is sometimes neglected in practice.
Example (medical technology): A manufacturer develops a new infusion pump controller. As part of the design FMEA, the team identifies potential errors, such as “the pump delivering too much medication unintentionally.” Causes could include a software error in the dosing algorithm, a stuck valve, or a programming error made by the user. The effects, which could include overdose and patient harm, are classified as very serious. Through FMEA, the team identified a critical cause: possible overheating of a sensor, which could lead to incorrect flow rates. This risk is assigned to a high RPZ. The design is changed to include an additional temperature sensor and an alarm in case of overheating. In addition, rigorous tests are defined. The result: The infusion pump is designed to minimize the identified risk, and the test instructions ensure reliable monitoring of the sensor. The FMEA documentation serves as proof to the testing laboratory and authorities that patient safety has been systematically considered.
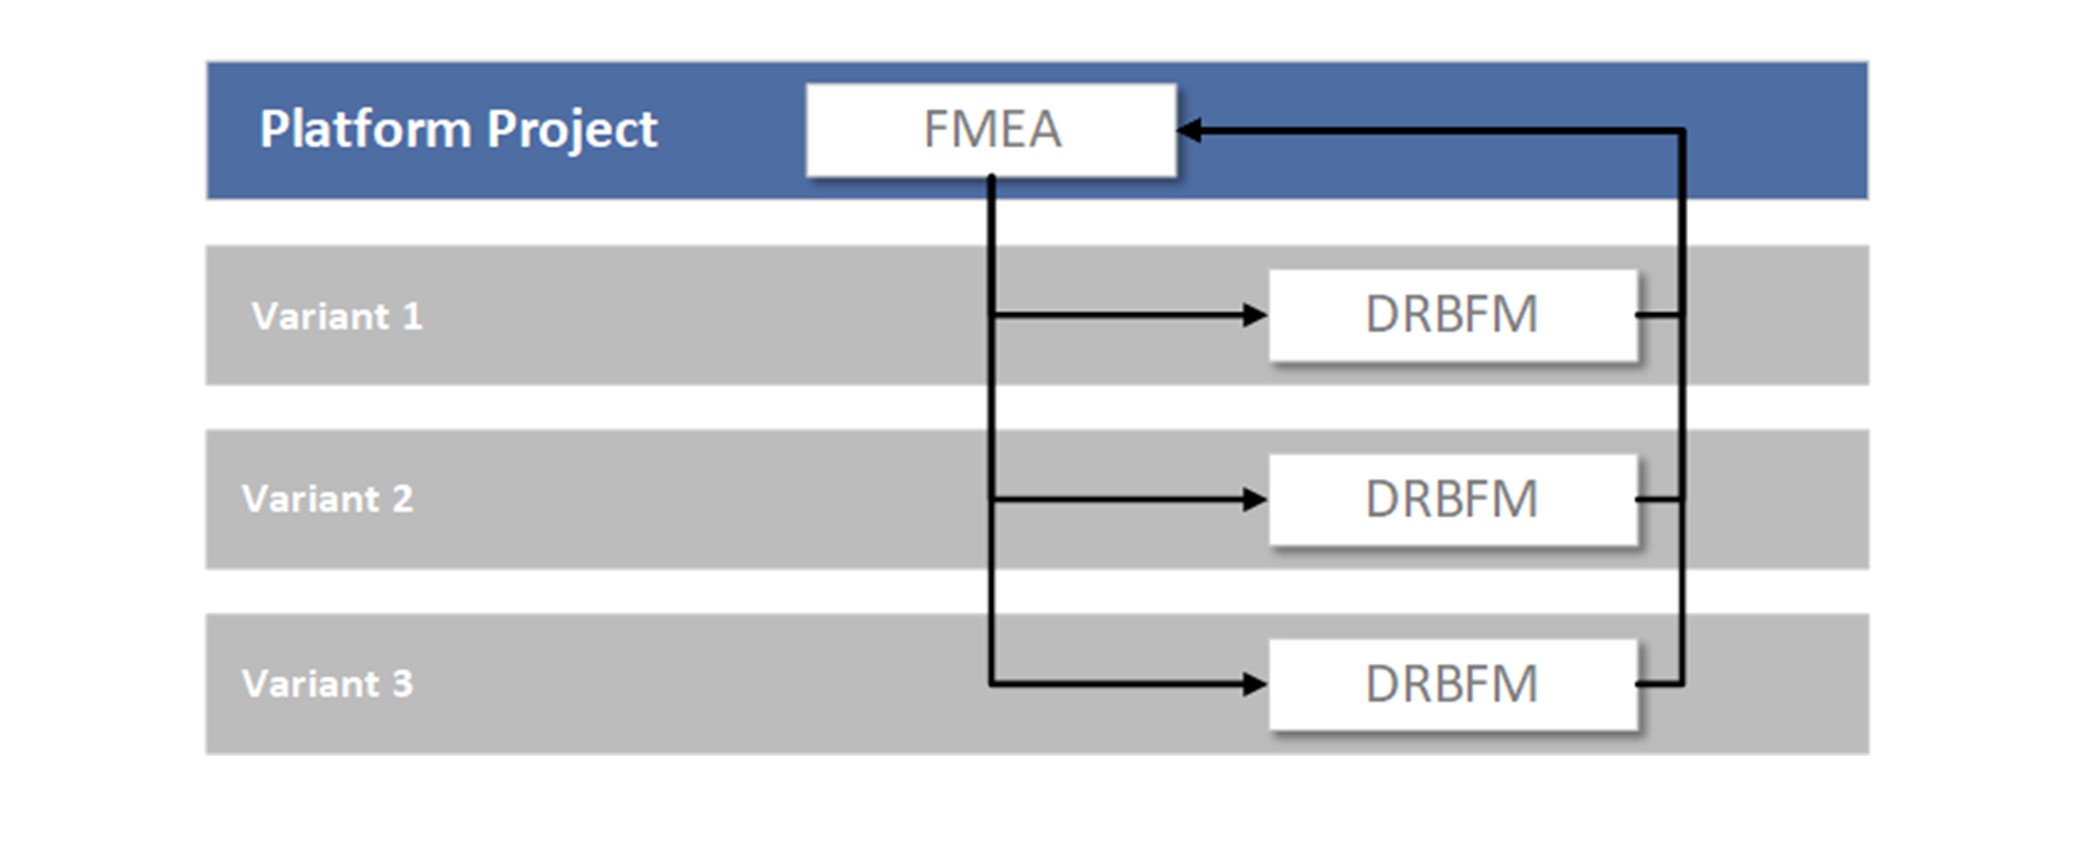
DRBFM (Design Review Based on Failure Mode) - Mastering Changes
DRBFM, a variant of FMEA, has proven particularly useful when changes are made to existing products. The basic idea is that new risks primarily arise from changes. Developed by Toyota, DRBFM essentially means “design review based on potential failure modes.” If you are further developing a medical technology device or planning a product update, DRBFM focuses specifically on the changes. What new failure modes could arise as a result? Which previous assumptions no longer apply? DRBFM is more pragmatic and focused than a complete FMEA of the entire product. It is becoming an increasingly popular alternative to classic FMEA for product variants in quality management. It allows for the quick yet secure implementation of changes, which is useful for product improvements or software updates in medical devices, for example.
Advantages:
- Focus on changes: Instead of reanalyzing the entire design, DRBFM focuses on the delta changes. This saves time and resources, as known, unchanged parts do not have to be completely reevaluated.
- Quick identification of new risks: Through targeted questions (What has changed? Why? What could go wrong as a result?), you quickly discover the critical points where a change could lead to problems. This ensures that subsequent product updates remain secure.
- Practical relevance: DRBFM promotes open discussions within the team about the changes. Engineers share their assumptions and jointly review the robustness. This often leads to simple but effective measures to prevent change errors (e.g., additional tests only for changed components).
- More efficient than a complete FMEA: A complete FMEA would be excessive for minor changes. DRBFM is a lean procedure that has withstood the test of time in the automotive industry and is gaining popularity in other industries.
Disadvantages/Limitations:
- Only suitable for changes: DRBFM is most useful when there is an existing, robust base system. For new developments, a regular FMEA must be performed.
- Experience required: The team must have a very good understanding of the original design and its functions. This is the only way to correctly assess the impact of the changes. Inexperienced teams may overlook risks because they fail to consider implicit functions or interfaces.
- No RPZ evaluation: Unlike FMEA, DRBFM does not usually use number-based prioritization. This can make it difficult to compare risks. It requires discipline to identify the most important risks and avoid getting lost in the details.
Example (medical technology): A company wants to change the battery type in a pacemaker model to extend its lifespan. Using DRBFM, the development team examines what changes with the new battery type. They discover that the new battery has slightly different voltage characteristics. One possible new fault scenario is as follows: When the battery is almost empty, the voltage could drop abruptly. In the worst case, this could lead to a pulse output failure. This scenario did not occur with the old battery type. To address this, the team decides to update the software to indicate a battery replacement earlier and to conduct thorough battery testing in the device. Targeted evaluations with DRBFM ensure that the new battery type does not pose any unexpected risks to patients.
Measurement System Analysis (MSA) - Ensuring Reliable Test Equipment
A measurement system analysis (MSA) examines whether your testing and measuring equipment delivers reliable, reproducible results. In medical technology, quality decisions often depend on measured values – e.g., the thickness of a catheter, the discharge dose of an inhaler, or electrical measurements on a device. MSA ensures the suitability of the measurement system by quantifying measurement deviations. Typical questions include: How high is the repeatability of a measuring device? How does the operator (reproducibility) affect the result? What is the overall measurement uncertainty? If, for example, you measure five identical products, ideally all measurements should deliver almost the same value – MSA reveals whether this is the case. This is important in regulated industries: ISO 13485 requires the monitoring and validation of test equipment, and the FDA expects decisions to be based on valid data. An MSA (e.g., performing a test equipment capability study or Gage R&R) provides this proof.
Advantages:
- Confidence in measurement results: With MSA, you know whether a test system is accurate and precise enough to decide whether a product is good or bad. This helps you avoid wrong decisions, such as rejecting good parts or accepting defective products due to unreliable measurements.
- Identification of measurement error sources: MSA breaks down the overall variation into components (e.g., operator influence, device tolerance, environmental influences). This allows you to identify where improvements can be made – perhaps staff need training, or a measuring device needs to be calibrated better.
- Regulatory compliance: Documenting an MSA shows auditors that your company systematically ensures that tests are meaningful. This supports the ISO 13485 requirement for capable measuring equipment and is often part of process validation.
Disadvantages/Limitations:
- Additional effort: A formal measurement system analysis requires numerous measurements (multiple parts, multiple repetitions, multiple employees) and statistical evaluation. This effort is easily avoided in a tight project schedule. However, it is usually justified, as unreliable measurements can cause much more expensive problems later on.
- Statistical knowledge required: The evaluation (e.g., gage R&R study) requires an understanding of variance analysis and statistics. Not every quality manager is well versed in this, which can lead to misinterpretations. Appropriate training or software support is necessary.
- Borderline cases are difficult to assess: MSA provides quantification, but the decision “Is my measurement system still acceptable?” can be difficult when results are borderline. The common guidelines (e.g., <10% deviation from the tolerance range) are not always strictly applicable, especially with tight tolerances in medical technology. Engineering judgment is sometimes required here.
Example (medical technology): In producing blood glucose test strips, an optical measuring device determines the reaction color intensity (and thus the glucose concentration). The quality team performs a measurement system analysis (MSA) by having different employees measure the same samples several times. The analysis shows that one operator consistently measures slightly higher values than the others. This could be due to different handling of the test device. Additionally, the measuring devices themselves were found to exhibit a certain degree of variation. Overall, the measurement uncertainty is ~15% of the tolerance, which is considered borderline. Based on these findings, the manufacturer trains employees to handle the devices uniformly and recalibrates them. A repeat MSA reduced the variation to 8% of the tolerance. This ensures that the test equipment is reliable and that only noncompliant test strips are discarded. These improvements increase confidence in quality testing and prevent patients from receiving faulty test strips.
Statistical Process Control (SPC) - Keeping Processes under stable Control
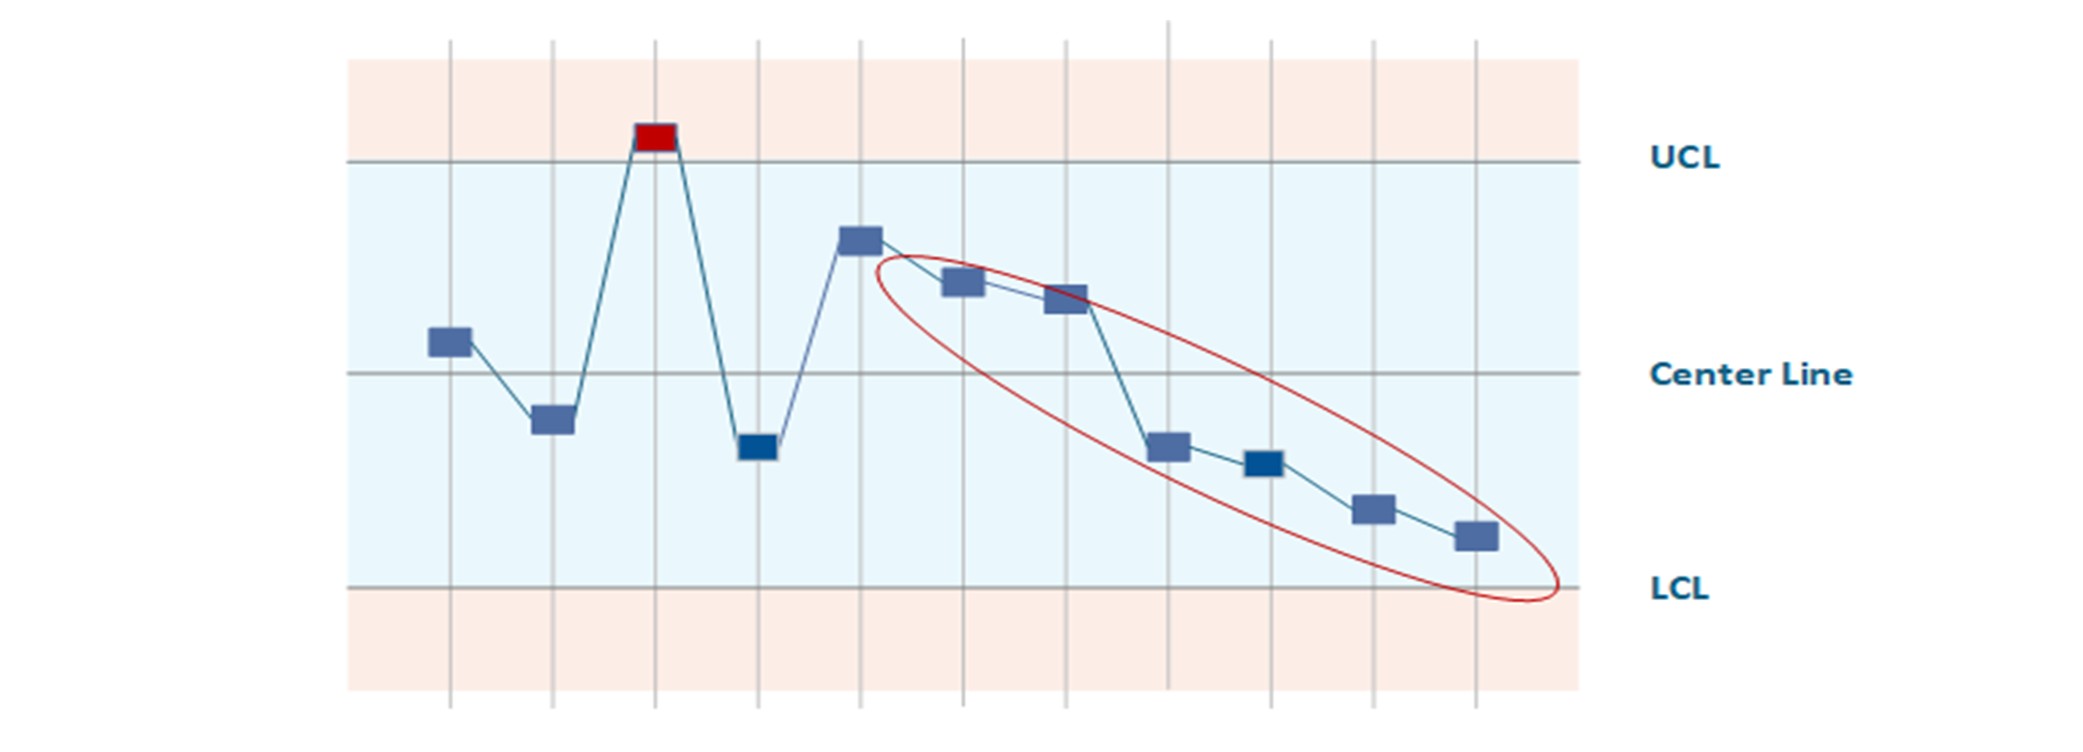
SPC (Statistical Process Control) is a methodology for monitoring ongoing manufacturing processes using statistics and detecting changes at an early stage. The core elements are quality control charts, on which process parameters (e.g., dimensions, weights, measured values) are continuously recorded. You define upper and lower control limits that represent the normal range of variation for a controlled process. If SPC detects a pattern or an outlier (a point outside the control limits or trends), this signals that the process is potentially out of control. Countermeasures can then be initiated before scrap or errors actually occur. In medical technology production, where there are high requirements for reproducibility (e.g., in the sterilization process, injection molding of components, or coating of implants), SPC is an important tool for quality assurance. It enables continuous process improvement (CPI) and serves as proof of process capabilities (Cp, Cpk values) to customers and auditors.
Advantages:
- Early Detection of Process Drift: SPC notifies you when a process exhibits unusual behavior, such as trends or outliers. This allows you to take corrective action before violating specification limits and generating scrap. This reduces costs associated with rework and rejects and increases delivery reliability.
- Objective Process Evaluation: Using process capability indices (Cp and Cpk), you can quantitatively assess whether a process is stable and capable. This is particularly important for quality-critical medical technology processes that must be validated.
- Sustainable improvement: SPC visualizes process performance over time. Improvement measures are shown directly on the control chart, making successes and areas requiring further action visible. SPC data enables line employees to act independently, strengthening the quality culture.
Disadvantages/Limitations:
- Not suitable for all processes: SPC requires specific quantities and amounts of data. However, in medical technology, there are small-series or batch productions with low quantities where SPC is statistically insignificant. Additionally, the measured values must be collected continuously. For some quality characteristics, such as complex functional tests, this is not always practical.
- Initial effort and expertise: Introducing SPC requires training employees and making an initial effort to select suitable control chart types, connect measurement systems, and set up evaluations. Without understanding, there is a risk that warning signals will be ignored or misinterpreted.
- False alarms versus inertia: Control limits that are set too narrowly can lead to frequent false alarms, which frustrate the workforce. Conversely, limits that are too wide detect deviations too late. The right balance must be found. Additionally, SPC only monitors known characteristics; it does not detect unknown types of errors.
Example (medical technology): In the manufacture of pre-filled syringes (e.g., heparin flush solution), SPC is used to monitor the fill quantity. Every 100th syringe is placed on a scale and the weight is recorded on a control chart. During the shift, the Xquer chart shows a slight downward trend in the filling quantity, although all syringes are still within specification. The SPC system alerts the shift supervisor, who takes immediate action: It is discovered that a nozzle on the filling system is gradually becoming clogged. The trend is stopped by cleaning the nozzle. Without SPC, this effect would not have been noticed until syringes were underfilled (outside the tolerance range), which would have resulted in a rejected batch. Thanks to SPC, the process remained under control and the quality of the batches could be ensured. The company also uses the SPC data to verify process capabilities and conduct regular process reviews.
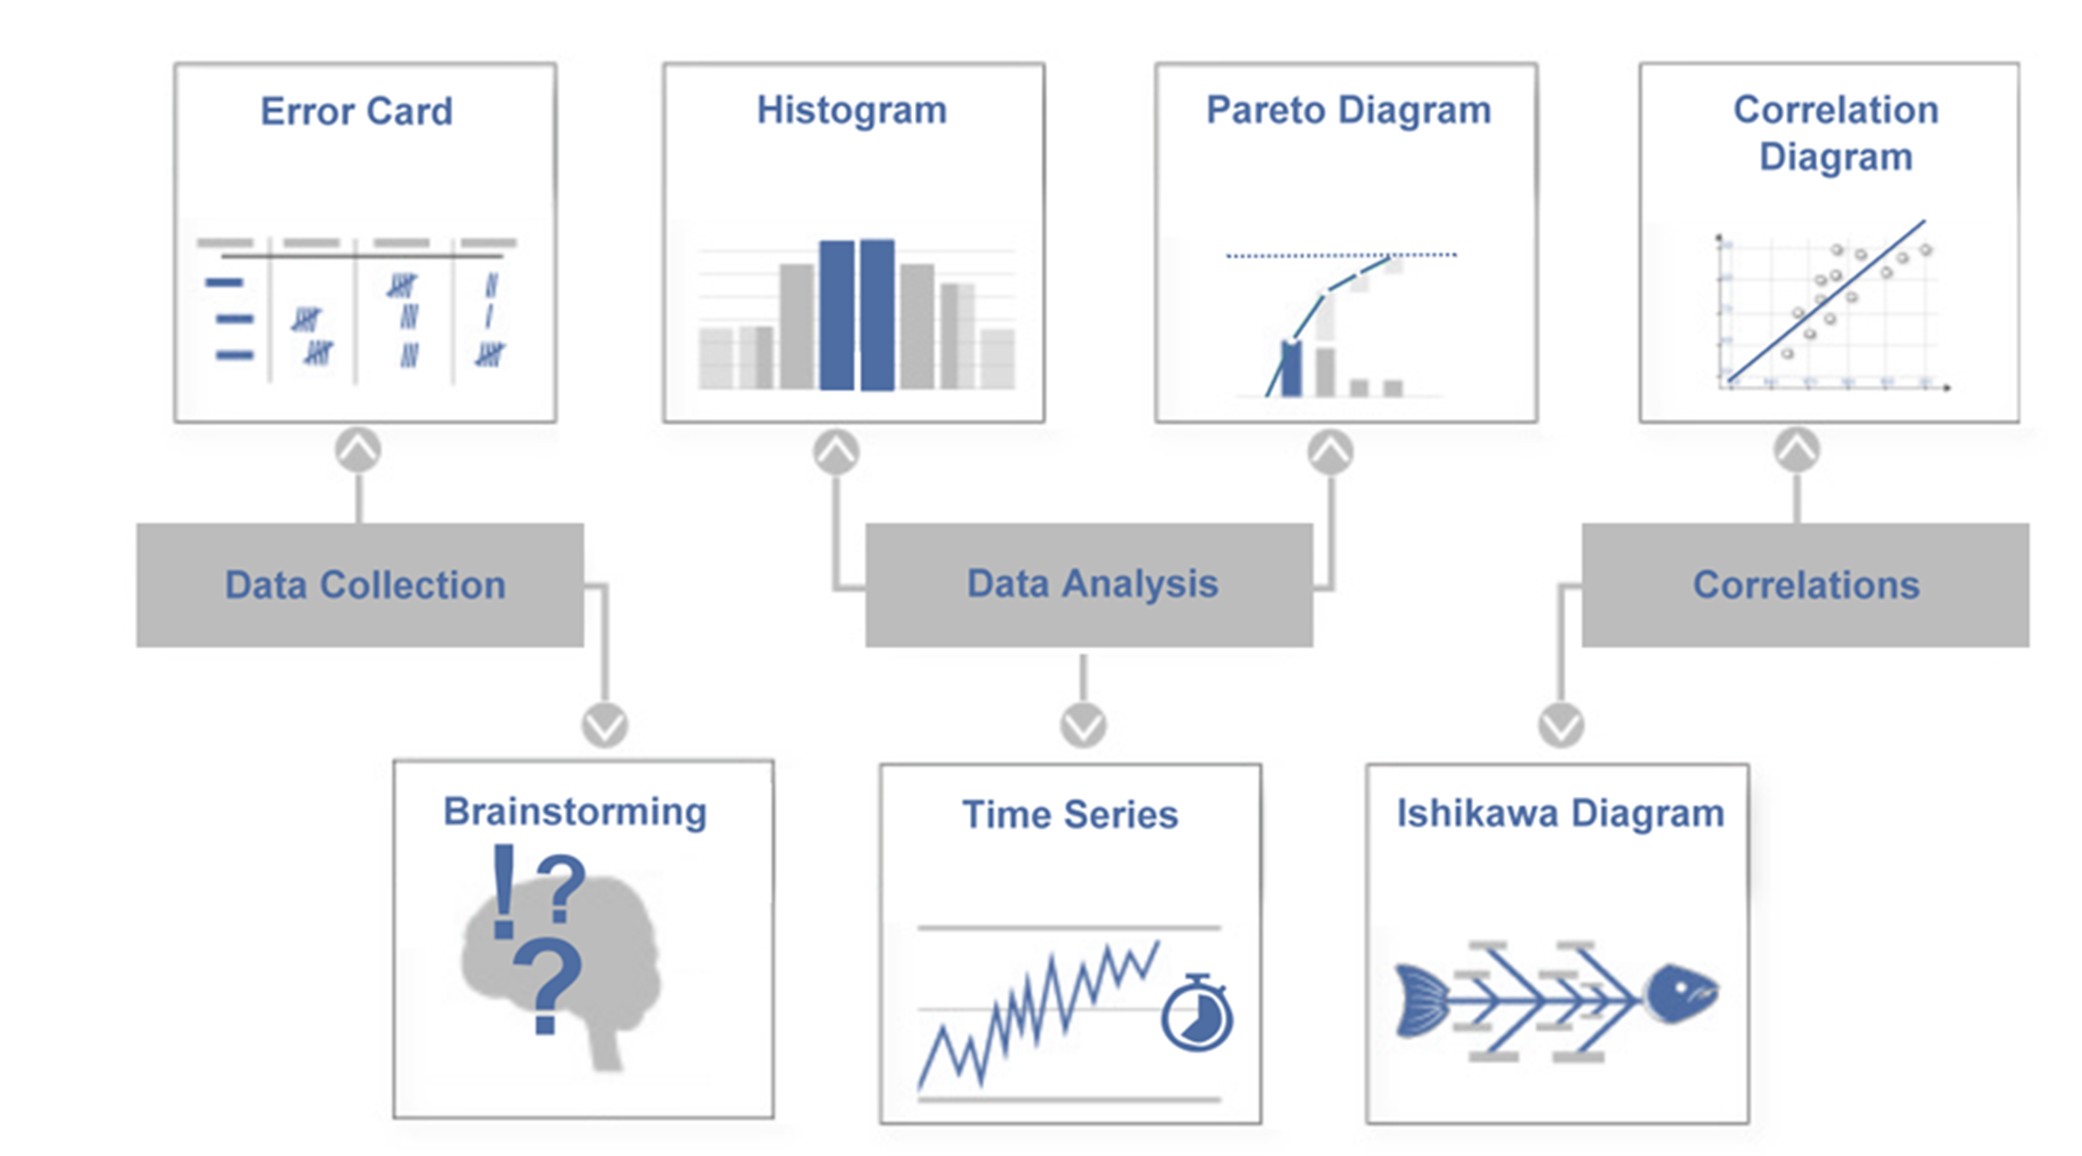
Seven Quality Tools (Q7) - Basic Quality Toolbox
The 7 quality tools (Q7) are a traditional set of straightforward yet effective methods for analyzing and solving quality issues. They are considered the foundation of a quality engineer’s toolkit. According to Ishikawa, the classic Q7 tools are brainstorming, error collection lists, quality control charts, cause-and-effect diagrams, histograms, correlation diagrams, and Pareto charts. These methods help collect and present facts to make solid decisions for improvement measures. In medical technology, the seven tools can be used for a wide range of applications, including complaint analysis and production optimization. Importantly, the Q7 are relatively easy to learn, making them a good starting point for beginners who want to approach quality issues in a data-driven way.
Advantages:
- Simple and versatile: The seven tools are intuitive and typically only require a pen and paper or basic software. You can apply them practically immediately without much effort. Despite their simplicity, they cover many situations, from identifying possible causes with the fishbone diagram to evaluating data with the histogram to prioritizing with the Pareto principle.
- Data and fact-based: Q7 helps back up subjective impressions with objective data. For instance, a Pareto chart quickly shows which types of errors occur most frequently so improvements can be made in those areas. This increases the accuracy of the measures taken.
- Wide awareness: Since these tools are part of basics of quality, they are widely used in many companies. Teams have a common language when talking about “Pareto analysis,” for example. This facilitates cross-functional problem solving.
Disadvantages/Limitations:
- Limited Depth: The seven simple tools can only partially capture complex, multivariate problems. For instance, a correlation diagram illustrates the relationship between two variables but not causality. More advanced methods, such as statistical test planning and Six Sigma tools, are required for deeper analysis.
- Manual application can be error-prone: When Q7 is carried out manually, data can be recorded or interpreted incorrectly. Additionally, it requires discipline to use the tools rather than just knowing them in theory.
- Often only a starting point: Q7s often reveal symptoms and initial hypotheses about the causes. For example, the fishbone diagram shows possible causes, and the Pareto chart shows frequencies. The actual solution often requires further steps, such as the 5 Whys method or experimentation, to truly eliminate the root cause of the problem.
Example (medical technology): A quality team at a laboratory equipment company is investigating frequent failures of a centrifuge device. First, the team collects data over a period of three months using an error collection list. Which error messages occur, in which area, and how often? A Pareto chart revealed that 60% of the failures were due to two types of errors: “overheating alarm” and “imbalance shutdown.” The team then created a cause-and-effect diagram (Ishikawa) for the overheating alarm and brainstormed possible causes within the following categories: people, machine, method, material, environment, and measurement. Among other things, they identify clogged ventilation filters (category: machine/environment) as a possible cause. An inspection confirmed that the ventilation slots of many failed devices were blocked by dust. As a result, a preventive cleaning program is being introduced, and the ventilation filter design is being improved. This example demonstrates how using several Q7 tools — error collection, Pareto, and Ishikawa — can quickly transform a confusing problem into clear causes and effective solutions.
Methods of Root Cause Analysis
Introduction
Despite all preventive measures, errors in the field or production can never be completely avoided. Root cause analysis methods help you systematically identify the root cause of an error when problems arise. Root cause analysis is a central component of the CAPA (corrective and preventive action) process in medical technology quality management. Regulators such as the FDA and ISO 13485 require companies to do more than treat symptoms when deviations occur; they must also identify and eliminate the true cause of the error. In fact, inadequate root cause analysis is one of the most common audit findings — if the cause is not correctly identified, corrective measures are often ineffective. The following methods will help you thoroughly analyze problems and implement sustainable solutions. We will explain the principles, advantages, and disadvantages of these techniques and provide examples of how they are used in medical technology to effectively investigate production errors, customer complaints, and safety incidents.
5W1H Method – Systematically Narrow Down the Problem
Before digging directly for causes, the 5W1H method helps to clearly narrow down the problem. 5W1H stands for the questions: Who, What, Where, When, Why, How. Note: Here, 5W does not mean the five-fold “Why?” questions, but there are five different W-questions that are asked. Through these questions, you gather all the basic information about an incident, much like an investigator or accident reporter would. For example, clarify: Who identified the problem (and who is affected)? What exactly happened (error pattern)? Where does it occur (location, machine, batch)? When did it occur first/last (time, after which event)? Why do you think it happened (first guess, trigger)? And: How has it been reacted to so far or could it be fixed for the time being? This structured collection of information forms the prelude to every root cause analysis. In many CAPA processes, a 5W1H form is an integral part of ensuring that the problem is understood and narrowed down before action is taken.

Advantages:
- Complete Problem Understanding: The 5W1H questions force you to look at all aspects of a problem, not just the most technically obvious. This gives you a comprehensive picture and allows you to avoid duplication of work or misfocusing.
- Easy to use: The questions are simple and universally applicable. Anyone in the team can answer them, and they quickly provide structured documented information. Especially in stressful situations (e.g. acute production stop), such a scheme helps not to overlook anything important.
- Basis for further analysis: 5W1H often already provides indications of possible causes or at least where to continue digging. In addition, the answers serve as a starting point for reports – e.g. they flow directly into an 8D report description.
Disadvantages / Limitations:
- No direct finding of the cause: The 5W1H method is for defining and containing problems, not for conducting actual root cause analysis. It describes what happened, but not why. The actual root cause analysis must then take place.
- Requires accurate information: If the available information is incomplete or incorrect (e.g., if the customer only reports that device is defective without further details), even the 5W1H method will remain vague. In this case, data must first be obtained (securing samples, interviewing participants, etc.) before the questions can be answered.
- Possible misconceptions: With “Why did it happen?” you may prematurely suspect a cause. However, treat this initial assumption with caution — validate it with later root cause analysis methods rather than taking it as fact.
Example (medical technology): A company receives a report from a hospital stating that an electrical surgical pen malfunctioned during an operation. Before rushing to the laboratory, the CAPA manager uses the 5W1H method to gather the facts. Who reported the incident? Operating room manager and experienced user. What exactly happened? The pen suddenly stopped working and the LED was off. Where? In operating room 3, device serial no. X, batch Y. When? After approximately 15 minutes of use; the patient was already undergoing treatment. Why? The technician on site initially assumed it was due to possible overheating or a loose connection. How was the situation handled? A replacement device was used, the patient was unharmed, and the defective device was taken out of service. Armed with this information, the team can now conduct a targeted analysis of the device in question (checking the overheating protection, soldering the contacts, etc.). The structured 5W1H protocol ensures all the necessary information is available and the investigation report is complete.
5 Whys Method – Getting to the Bottom of the Causes
The 5-Whys method, also known as the 5-Whys, is a simple questioning technique that involves repeatedly asking “Why?” to gradually work from a problem symptom to its underlying cause. The number five is more of a guideline — the idea is to ask “why” until you no longer have a valid answer, revealing the core of the problem. This technique is often used with the Ishikawa diagram. First, identify possible causes broadly, and then dig deeper into probable causes. The appeal of the 5-Whys method lies in its simplicity; you only need common sense and honesty. In medical technology, for example, the 5 Whys method is well-suited to the CAPA process for incidents or complaints, ensuring that you don’t get stuck on superficial reasons. Incidentally, children are natural experts at this method — they keep asking “Why?” until adults run out of answers. You should be just as persistent when dealing with quality problems.
Advantages:
- It’s quick and easy to use: Anyone can use the “5 Whys” method right away; no training is necessary. This method encourages focused thinking about cause chains and can quickly resolve simple problems.
- Get to the root cause: By consistently asking questions, you avoid treating symptoms too quickly. Often, you arrive at process or systemic weaknesses that originally triggered the problem. This leads to more effective solutions.
- It is low effort and documentable: The 5-Whys method can be easily documented and traced in a CAPA report. It is also an effective communication tool for demonstrating to managers or auditors that you have methodically identified the root cause.
Disadvantages / Limitations:
- Linearity: The 5-Whys method typically examines a cause-and-effect chain in depth. However, many problems, especially those in complex medical technology systems, have multiple factors. If you only follow one path, you risk overlooking other contributing causes. Therefore, in complex cases, the Five Whys method should be combined with a broad-based root cause analysis (Ishikawa diagram or data analysis).
- Depends on the knowledge of those involved: The answers to the “why” questions must come from the team. If knowledge or honesty is lacking, the answers may be incomplete. For example, if you ask, “Why did the test fail?” – “Because the employee was inattentive.”), you may not get to the true cause. Sometimes, it takes more than five questions, as well as measurements and investigations, to determine the actual cause instead of making assumptions.
- No quantitative weighting: The 5-Whys method provides a qualitative analysis, but not necessarily a prioritized one. If several causes are found, this method does not help determine which is the most critical or frequent. This would require additional analyses (e.g., Pareto).
Example (medical technology): A higher bacterial load was recently detected in a sterile filling process. The team used the 5-Whys method to investigate. Why are there bacteria in the product? Because the sterile filter allowed bacteria to pass through, according to laboratory findings. Why did the filter allow bacteria to pass through? Because it was damaged. Why was it damaged? Because it was handled incorrectly during installation, causing a fine crack to develop. Why was it handled incorrectly? Because the employees had not received training on the new filter system. Why was there no training? Because the change process failed to initiate training (system gap). This chain of questions helped the company recognize that the actual cause was not simply a “defective filter,” but rather a process error in training and change management. The CAPA measure aims to improve training processes and ensure training is provided automatically when technical changes are made. In addition, all defective filters will be replaced. In this case, the 5-Whys helped look beyond the initial technical defect to uncover a systemic need for improvement.
Pareto Analysis – Focusing on the Essentials
The Pareto method, also known as the 80/20 rule, is a simple yet effective way to prioritize problems or causes. It is based on the principle that, in many cases, a small proportion of causes accounts for a large proportion of effects. For example, 20% of error types may cause 80% of complaints. This concept was first observed by the Italian economist Vilfredo Pareto and later applied to quality control by the renowned quality management expert Joseph Juran. The method typically involves performing a frequency analysis of error types or causes and displaying the results in a Pareto chart, which is a bar chart with a cumulative curve (see the graphic below). This allows you to see at a glance which problems or types of errors contribute most to quality defects, so you can focus your resources on these areas. In medical technology, Pareto analysis is ideal for analyzing complaint data, reasons for failure, and nonconformities in audits. It can also be used to identify the most effective levers.
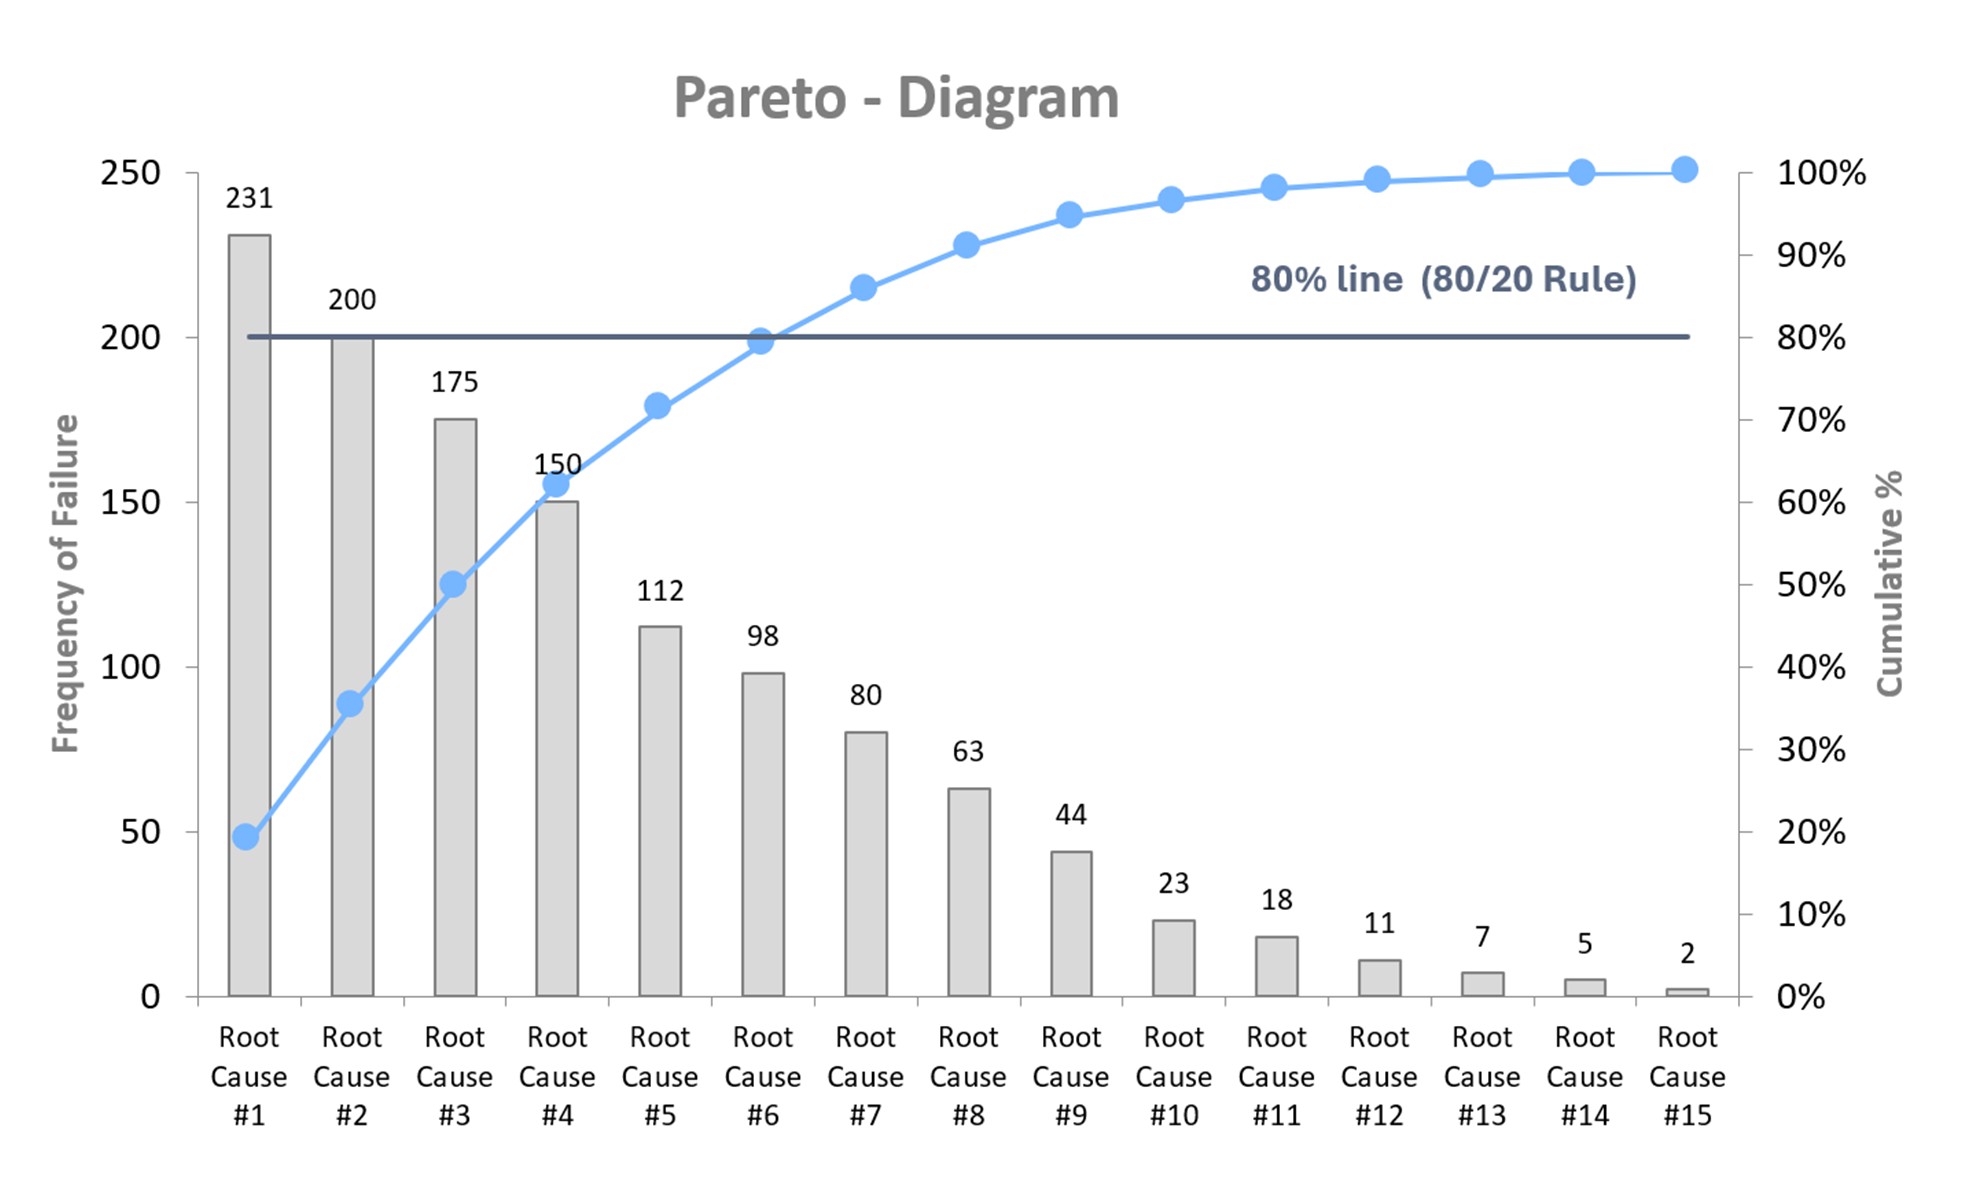
Advantages:
- Focus on the essentials: Rather than addressing all types of errors simultaneously, Pareto analysis reveals the few primary causes responsible for the majority of issues. This saves time and resources while ensuring you start where it will be most beneficial.
- Simple, fast, and visual: It is easy to understand and requires only basic data and Excel or a similar tool. The Pareto chart is intuitive and ideal for presenting decision-making criteria quickly to management or in team meetings.
- Basis for further analysis: The identified “Pareto leaders” can then be examined in greater depth using other methods (e.g., Ishikawa or the 5 Whys method). In this way, Pareto provides a well-founded prioritization of the root cause analysis.
- Very versatile: Whether you are analyzing downtime, customer complaints, audit deviations, or inspection feature violations, Pareto analysis quickly provides clarity wherever data frequencies are available.
Disadvantages/Limitations:
- Frequency only, not severity: Pareto shows what happens often, not what is particularly dangerous or expensive. Relying solely on Pareto can cause a rare but critical deviation (e.g., a life-threatening product failure) to remain under the radar. Therefore, for safety-critical issues, you should always consider risk and impact in addition to FMEA.
- Data quality is crucial: The significance of the results depends heavily on the classification and accuracy of the input data. If error types are recorded inconsistently or too roughly, the analysis may be distorted. Data collection and categorization must be carried out in a disciplined manner to achieve meaningful results.
- Not suitable for small amounts of data: Pareto analysis is not helpful when there are very few instances (e.g., fewer than ten); in such cases, a case-by-case analysis (e.g., the Five Whys method) is more appropriate. Pareto analysis works best with larger samples from which trends can be derived.
Example (medical technology): A company that manufactures electronic patient monitoring devices has seen an increase in service calls. The quality management team collected all complaints from the past year and categorized them. “Battery life too short,” “software freeze,” “display failure,” “false heart rate alarm,” etc. The frequencies are recorded and displayed in a Pareto chart. The analysis reveals that three types of faults account for 78% of service calls: display failure (due to cracking from mechanical stress during transport), software freezing, and false heart rate alarms. The team focuses on these root causes and initiates a root cause analysis using the 5-Whys and a design review. They discover that the displays were inadequately protected against impact. Design changes to the housing and new transport specifications solve the problem. Follow-up complaints drop dramatically. Without the Pareto analysis, the team might have tried to solve all the errors at once and wasted a lot of effort on minor problems. This demonstrates that using Pareto allows one to work smarter, not harder.
Cause-and-effect diagram (Ishikawa) – Systematically Collecting Causes
The Ishikawa diagram, also known as a fishbone or cause-and-effect diagram, is a graphical tool used to categorize possible causes of a problem. Developed by Kaoru Ishikawa, it is traditionally drawn in the shape of a fishbone. The “head” of the fish represents the problem (effect), while the main bones represent typical cause categories (e.g., people, machines, methods, materials, environment, and measurement, often referred to as the “6 Ms”). All possible causes are noted as secondary branches on these main bones (see the figure below). This method encourages team members to creatively and comprehensively search for possible sources of error without prematurely ruling anything out. In medical technology, the Ishikawa diagram is useful for complex problems where many factors could play a role, such as unclear test results, sporadic device failures, and process fluctuations. Visualization reveals existing and missing knowledge. Ishikawa diagrams are often created through brainstorming and, more recently, with mind-mapping software to clarify them.
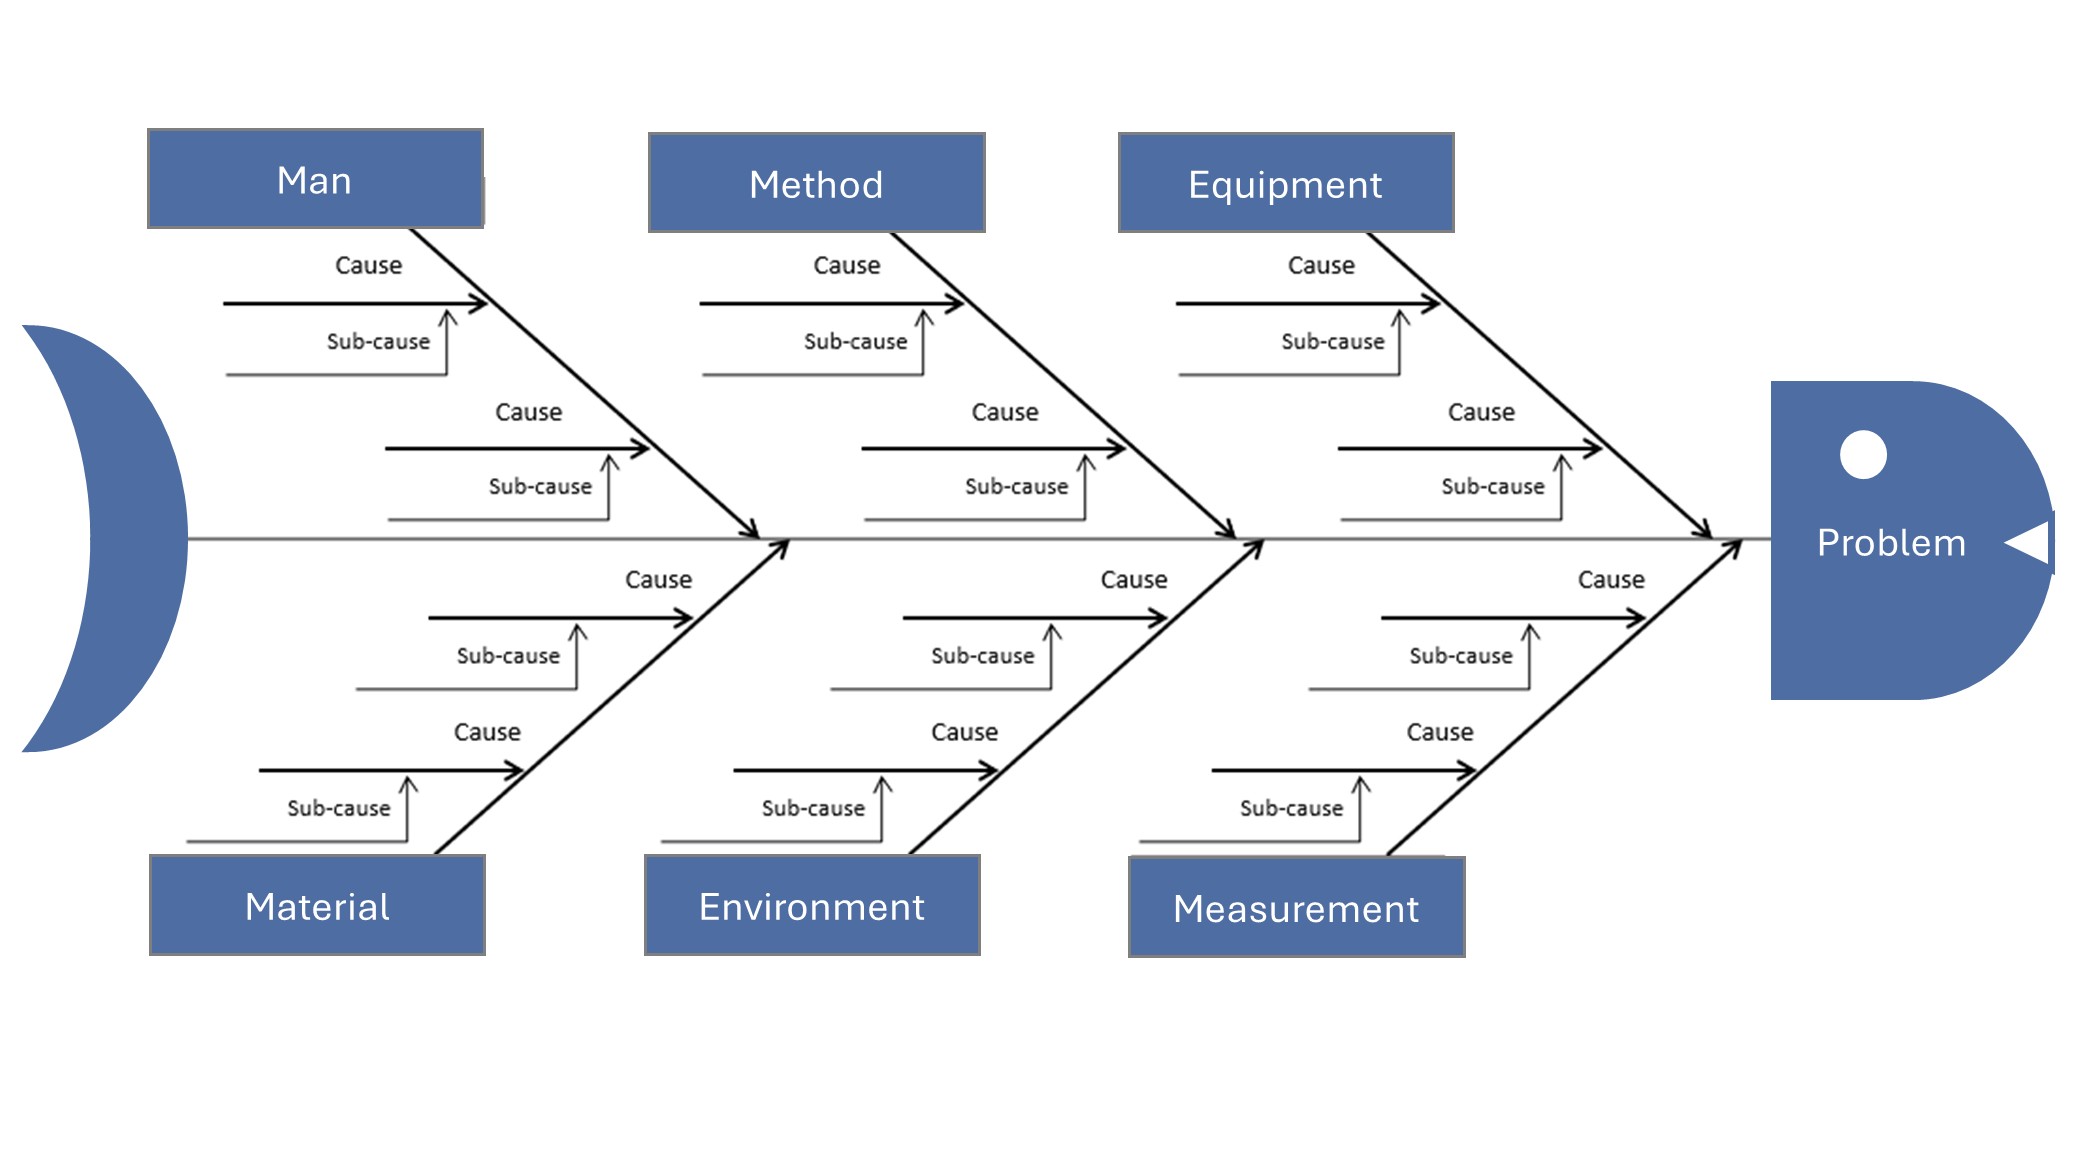
Advantages:
- Structured and Comprehensive Root Cause Analysis: The fishbone diagram helps you think systematically by categorizing information, ensuring that no dimension (e.g., people, technology, environment) is overlooked. This allows you to quickly and broadly narrow down possible causes of errors.
- Visualization promotes understanding: All team members can see the collected ideas and their interrelationships at a glance. This creates a shared understanding of the problem and reveals knowledge gaps (e.g., if few people contribute to a category).
- Easy derivation of measures: Once the possible causes have been identified, initial countermeasures or tests can be developed for the most promising ones. The diagram clearly shows where priorities should be set.
- Can be easily combined with other methods: Ishikawa is often the starting point for analysis. Then, the most promising branches are explored in more detail using methods such as the 5 Whys or data analysis. Thus, the diagram provides a flexible framework for further root cause analysis.
Disadvantages / Limitations:
- No automatic weighting or proof: The diagram lists possible causes, but does not indicate which is the primary cause. Without subsequent verification, such as experiments or data, there is a risk of focusing on the wrong cause or overlooking an important one.
- Complexity with very large problems: If a problem has many possible influencing factors, the Ishikawa diagram can become overly complex and confusing. In this case, it loses its usefulness. In this case, it helps to first narrow down the problem using the 5W1H method or split large diagrams into sub-problems.
- Quality depends on team knowledge: This method requires that the team be familiar with the process and its influencing factors. When dealing with completely new or unknown processes (e.g., new technologies), brainstorming may be inadequate. Ishikawa alone has its limitations in such cases. For stubborn, long-standing problems, more extensive analyses (e.g., AFD or experimental design) are often necessary.
- Presentation must be kept neat: When written by hand on a whiteboard, especially when many notes are added, the result can be illegible or chaotic. In this case, it is advisable to switch to digital mind maps to ensure readability and documentation.
Example (medical technology): During the production of dialysis machines, devices sometimes fail the end-of-line test because they do not pass the pressure test due to a slight leak. Engineers then create an Ishikawa diagram with “leakage in pressure test” at the fish head. They use the 6 Ms as the main categories: people, machine, method, material, milieu, and measurement. Under the category of material, possible causes are identified, such as a defective sealing ring or porous hose material. Under “method,” they list incorrect tightening torque during assembly as a possible cause. The milieu category brings temperature fluctuations into play, and the measurement category adds the possibility of a leaky test setup. After the brainstorming session, the team had collected about 15 plausible causes. Now, they prioritize. They notice that all leaky devices were manufactured in Shift B. This draws attention to the assembly workers, and they discover that an employee on shift B did not consistently check the torque with a screwdriver. The screw connections were often too loose. They found the cause: retraining the employee and introducing a second check step (the four-eyes principle for torque) could avoid future leaks. Without the Ishikawa diagram, one might have concluded that there was a material defect, but the systematic analysis revealed the true cause in the process.
Fault Tree Analysis (FTA) – Logical Error Trees for Complex Causes
Fault tree analysis (FTA) is a deductive method that logically derives all combinations of causes that can lead to an observed problem, or top event. Unlike the broad Ishikawa approach, which simply lists causes, FTA builds a graphical tree structure. The undesirable event (e.g., “device fails”) is at the top, and logical gates (AND/OR) branch out below it to sub-events that could jointly cause the top event. FTA is often used in safety-critical areas because it can be used to calculate probabilities if the failure rates of the basic events are known. In medical technology, for instance, the IEC 60812 standard recognizes FTA as a valid risk analysis method. FTA is suitable for analyzing multicausal relationships. For instance, a device alarm not sounding despite a fault could require several simultaneous failures, which are modeled in the fault tree. FTA is often used top-down after an incident but can also be used preventively, similar to a reverse FMEA, as a fault tree in the design phase for highly critical functions.
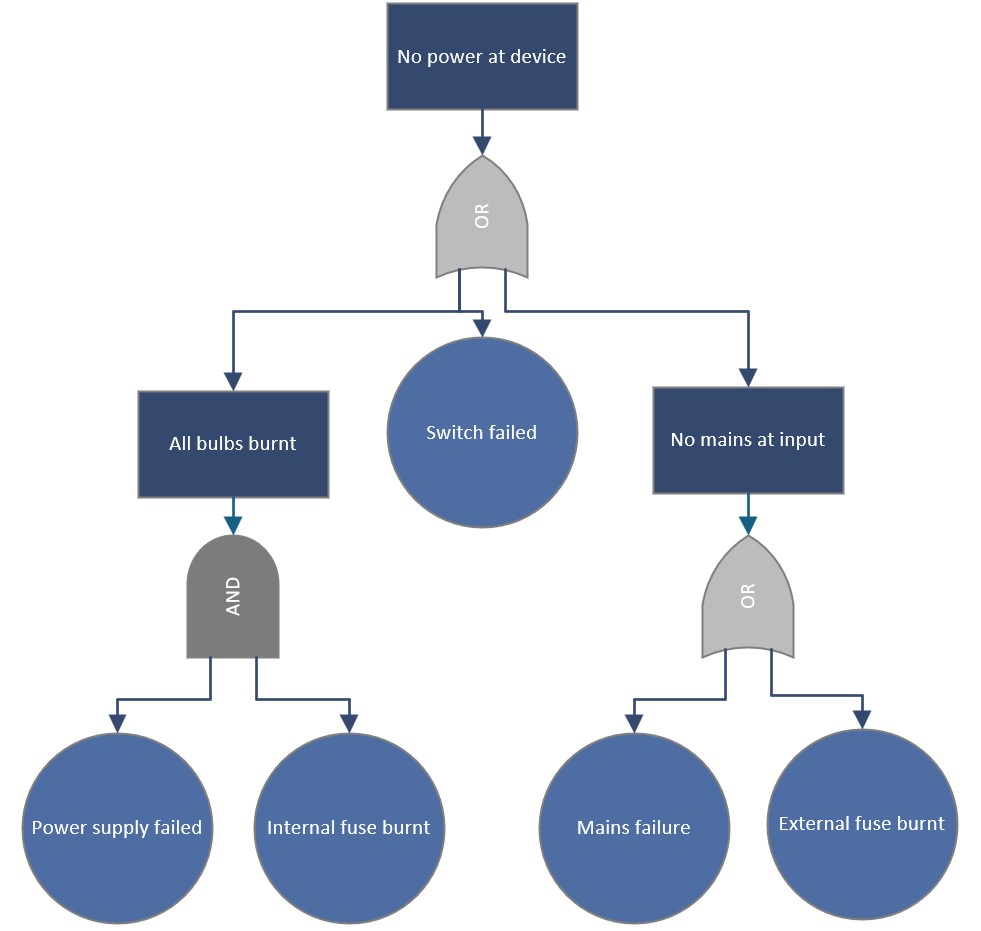
Advantages:
- Thoroughly analysis of complex combinations of errors: FTA forces you to systematically uncover all the logical paths leading to a top error. This process also reveals unusual combinations that could be overlooked through simpler brainstorming methods. This is particularly valuable when several independent failures must occur simultaneously (common cause analysis).
- Quantification is possible: If your company has failure data or reliability metrics, FTA can calculate the probability of the top event failing. This shows whether a risk is acceptable or if additional safety measures are necessary. This quantification (e.g., calculation of a total failure rate per 10⁶ hours) is often required for approvals and safety certifications.
- Visual, logical model: The fault tree is a clear diagram that shows stakeholders who are not familiar with the subject matter (e.g., management or auditors) the chain of errors necessary for a serious accident to occur. It helps objectify discussions (“Here you can see — only if two independent sensors fail at the same time does X happen”).
- Complements FMEA for systemic risks: While FMEA focuses on individual errors, FTA covers systemic relationships. Together, they provide a comprehensive view of the risks.
Disadvantages / Limitations:
- Complex for Large Systems: A complete fault tree for a complex medical device may contain hundreds of basic events and can become extremely large. Maintaining its accuracy and timeliness is labor-intensive and requires care. Small design changes can render a section of the tree obsolete, making maintenance demanding.
- Requires in-depth system knowledge: In order to build a meaningful fault tree, one must have an in-depth understanding of system behavior and possible failure modes. Otherwise, there is a risk of making incorrect assumptions or failing to consider relevant paths. Therefore, the method requires experienced experts and often interdisciplinary collaboration (e.g., hardware, software, mechanics, and clinical).
- Probabilities are not always available: Especially with new devices, reliable component failure rates may not be available. In this case, quantification is based on estimates, which limits the significance of the results. Additionally, FTA is only as good as the input data. Rare common causes, such as overvoltage damaging two systems at the same time, are difficult to model.
- It is primarily reactive or used for specific top events: FTA assumes a defined top fault. It is not particularly suitable for general cause analysis without a clear initial problem; in this case, Ishikawa is faster. Therefore, FTA is usually used after an accident or fault, or for predefined critical events (e.g., “patient harm due to radiation overdose”).
Example (medical technology): After an incident in which a defibrillator failed to deliver a shock, narrowly avoiding patient injury, a manufacturer conducts an FTA. Top event: “Defibrillation fails; no shock.” The fault tree below branches out into electronic faults OR user error OR a dead battery. The engineers further break down the electronics branch: The electronic fault could be caused by a defective capacitor and by the diagnostic software not recognizing it. Both would have to occur together (i.e., an AND gate). The user error branch is divided into “electrodes incorrectly attached” and “operating procedure not followed.” This provides a comprehensive picture of all possibilities. The analysis shows that the probability of a capacitor failure and a detection software failure occurring together is extremely low. The “battery empty and no one noticed” scenario is more common. In response, the manufacturer implements a louder battery alarm function and trains users to check the battery before each shift. The FTA made it possible to systematically investigate technical and human factors, preventing the serious top error from occurring in the future.
Shainin Method – Statistical Root Cause Identification in Process
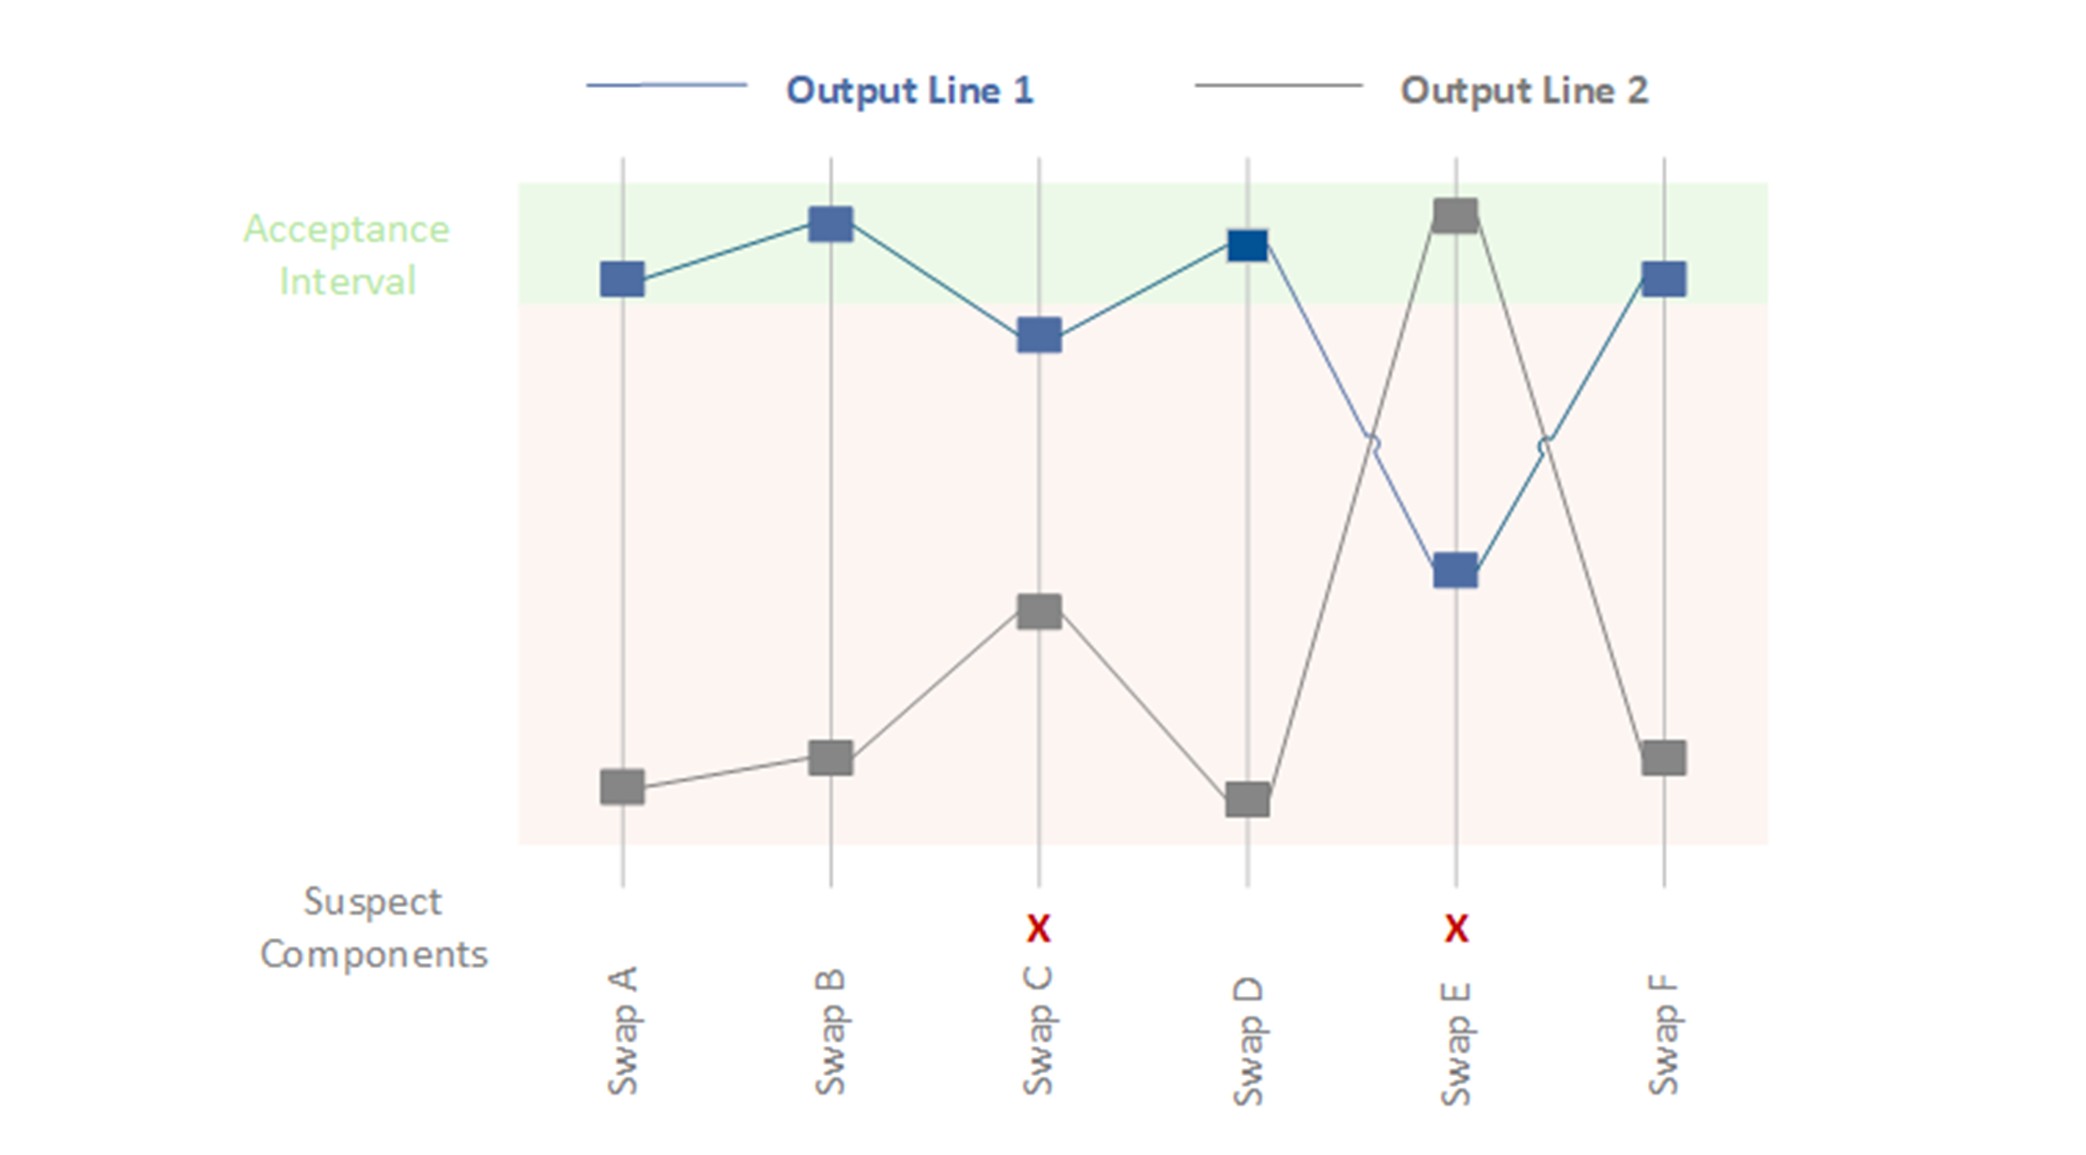
The Shainin method, also known as the homing-in technique, is a pragmatic toolbox for root cause analysis, particularly in process optimization, according to Dorian Shainin. Shainin’s approach follows the principle of “let the data speak” and aims to identify the primary cause of a quality issue with minimal effort. Rather than treating all possible causes equally from the outset, Shainin gradually isolates the most significant influencing factor. Typical techniques include component swaps, which involve systematically replacing parts between good and bad parts to identify the problematic part, and multi-vary analyses, which involve statistical evaluations of variation within, between, and over time. The Shainin method’s strength lies in the fact that extensive theoretical models are unnecessary; one can experiment directly on the real process until the cause is narrowed down. In medical technology, the Shainin method can address process issues when production batches yield inconsistent results and traditional root cause analysis has been unsuccessful. Shainin has also been used in healthcare to identify the causes of medical errors or inefficient processes.
Advantages:
- Focus quickly on the root cause: By systematically “homing in” on the red X, you can often identify the main culprit in the process with a few attempts. This saves resources because you don’t have to examine all factors in detail; you can quickly filter out what doesn’t matter.
- User-friendly and practical: They are relatively easy to understand and use, even without in-depth statistical knowledge. This makes them popular on the shop floor. You can work directly on practical problems with real data, which is often more effective than theoretical analysis.
- Low data requirements: Unlike traditional Six Sigma approaches, which use extensive data sets and full factorial test plans, Shainin uses a few targeted experiments or comparisons. This is particularly helpful in medical technology, where limited samples are sometimes available.
- Focus and speed: By focusing on one variable at a time (e.g., through pair comparisons, asking, “What is different between good and bad?”), solutions can often be found in a matter of days, whereas conventional methods would take weeks. For this reason, Shainin is often used to quickly address acute manufacturing problems.
Disadvantages / Limitations:
- Limitation to a single root cause: The method looks for one dominant cause. For very complex problems involving several comparable factors, Shainin may be ineffective or overlook an important, though less dominant, cause.
- Experience and intuition are required: Although Shainin tools are simple, a good understanding of the process is needed to select appropriate comparison strategies. Less experienced users could draw the wrong conclusions if they do not control confounding factors, for example.
- Not always formally recognized: In highly regulated environments, statistically sound evidence, such as p-values and confidence intervals, is sometimes desired. Shainin provides pragmatic results, but critical auditors may demand more in-depth figures. Sometimes, Shainin is used internally to determine the cause, and then a formal design of experiments (DoE) is submitted to prove causality.
- Change management: Introducing the Shainin philosophy may be met with resistance if the organization strongly favors traditional approaches. Management support is required to ensure teams are open to this different approach to problem-solving.
Example (medical technology): Two production lines for blood bags have variable weld seam strengths. Some bags from one line burst during stress testing, while bags from the other line are much more durable. A standard cause analysis (Ishikawa or 5 Whys) did not reveal a clear cause because many factors were at play, such as material batch, welding temperature, contact pressure, and cooling time. The Shainin method is now being used. Several “good” (durable) and “bad” (leaky) bags are selected, and pair comparisons are made. First, the film material is systematically swapped between the two lines to see if the problem migrates. No, the material does not appear to be the Red X. Then, the welding tools are examined. An experienced technician was sent from the good machine to the bad machine to see if the problem was human error. There was no change, but when the welding die was switched from the good machine to the bad machine, the bad machine’s results improved significantly. The main cause (Red X) is the welding die or its condition. A closer inspection reveals fine scratches on the contact surface of the problematic die that led to uneven heat distribution. The problem is solved by replacing or reworking the die. The Shainin strategy (“systematic replacement and isolation”) quickly revealed the cause, whereas a broad-based analysis would have taken much longer.
Deltalyze – Fast Problem Solving à la Daimler
Deltalyze is a unique problem-solving method developed by Daimler AG. The name is derived from “delta” (difference). Deltalyze essentially pursues the same goal as Shainin: quickly narrowing down the cause of an error by analyzing the differences between functioning and faulty units. It combines structured questionnaires, data analysis, and expert-based troubleshooting. While this method is less common outside of Daimler, the approach of focusing on differences can be applied in other industries. Although there is no standardized Deltalyze method in medical technology, companies use similar principles internally. For example, in the event of a device malfunction, one could ask: “What distinguishes the faulty devices from the good ones?” (Different batches, operators, or suppliers, etc.) One could then derive hypotheses from these differences. Deltalyze is an example of the best practices for problem solving that large companies have developed to become more efficient in dealing with complaints.
Advantages:
- Focus on differences: Deltalyze immediately highlights what is different when an error occurs. This significantly speeds up the process of identifying the cause because you are not searching through all the possibilities, but rather investigating specific variations.
- Tried and tested: Deltalyze was so successful at Daimler that it was named a separate methodology. It combines proven tools, such as the 5-Whys and data analysis, into a single process. Medical technology companies may be inspired to develop their own troubleshooting standards that work just as quickly.
- Team involvement: Methods such as Deltalyze often rely on moderated workshops with experts to quickly gather knowledge. This approach strengthens the team’s problem-solving skills and ensures that all relevant differences are highlighted.
Disadvantages / Limitations:
- Proprietary and poorly documented: There is little detailed guidance available outside the group. Companies would have to develop their own processes. Without clear guidelines, Deltalyze could become just a buzzword, so its effectiveness depends on how it is implemented.
- Requires comparable cases: The idea of “difference analysis” only works if you have sufficient comparative data, i.e., cases with and without errors. This approach does not work well for unique problems, such as a one-time incident with no comparison.
- No miracle solution: Ultimately, Deltalyze uses familiar tools in a structured way. If teams are already working well with 8D, Shainin, etc., then Deltalyze, with its new name alone, does not add any value. In fact, it could cause confusion to suddenly start promoting a new method that essentially does the same thing.
Example (medical technology): A manufacturer of hearing aids experiences an unusually high number of failures in a particular batch shortly after delivery. An internal “Deltalyze”-like team is formed. The team compares the defective hearing aids with intact ones and finds that all of the defective devices were manufactured during the same production week from a new delivery of micro solder. The functioning devices were either produced earlier or with the old solder. In this case, the soldering material stands out as the delta. Further investigation confirms that the new solder contained impurities that caused cold solder joints. The company withdrew the batch and switched to the proven material. This fictional example shows how focusing on differences (e.g., time, delivery batch) can quickly lead to identifying the cause. In practice, the cause could have also been discovered using traditional methods, but a formalized approach, such as Deltalyze, would have prompted the team to specifically look for these types of differences.
8D Report – Structured Team Process for Troubleshooting
The 8D method, also known as the Eight Disciplines, is an eight-step standardized process for solving problems that is primarily used in complaint management. An 8D report walks you and your team through each important step: team composition (D1), problem description (D2), immediate measures (D3), root cause analysis (D4), corrective measures (D5), effectiveness verification (D6), preventive measures (D7), and completion (D8—team recognition). This holistic approach ensures that the technical cause is found and that environmental factors are considered. For example, temporary measures are taken to immediately protect the customer, and checks are made to see if something similar could happen elsewhere. Although 8D is not mandatory in medical technology, many companies use it similarly to CAPA because it provides clear documentation and specified thought processes. In the automotive sector, the 8D report is often mandatory for supplier complaints, which has promoted its use in other industries as well.
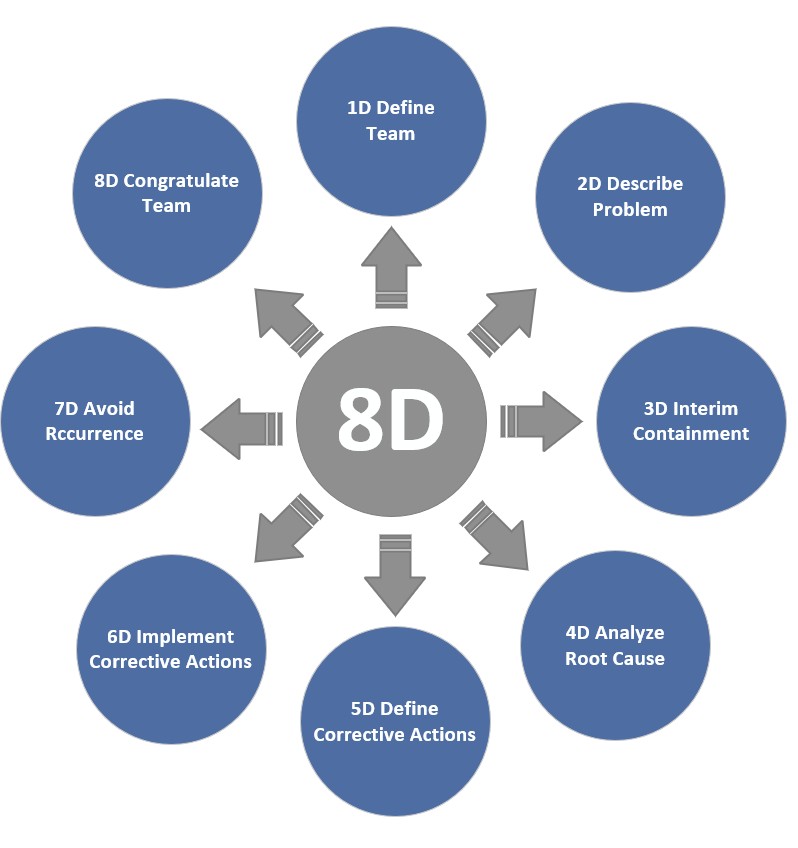
Advantages:
- Systematic and comprehensive: The 8D method ensures that your team does not overlook anything important. In particular, separating immediate containment (D3) from permanent elimination (D5), and explicitly verifying effectiveness (D6), correspond to best practices in the CAPA process. This structured process reduces the risk of prematurely “ticking boxes” without resolving the root cause.
- Team Orientation: The 8D method emphasizes forming an interdisciplinary team (D1). This promotes collaboration and leverages collective knowledge. Problems are not dealt with in isolation by individuals, but rather collectively, which often leads to more creative solutions.
- Documentation and communication: A completed 8D report serves a clear communication report to customers, management, and regulatory authorities how the problem was addressed. It transparently shows how the problem was addressed. In medical technology, in particular, a solid 8D report can demonstrate the effectiveness of the CAPA process in an ISO 13485 audit.
- Sustainability: Step D7 (preventive measures) examines how lessons learned can be applied to similar processes or products to prevent errors from recurring elsewhere. These lessons learned improve long-term quality.
Disadvantages / Limitations:
- Time and documentation effort: Critics note that the 8D process can be excessive for minor problems with low risk. Filling out the report and going through all the steps takes time. Requiring a full 8D for every little thing can also paralyze an organization. Therefore, the method should be focused on medium to large problems, while minor issues may require a leaner approach.
- Requires training and discipline: An 8D is only as good as its implementation. Without training, teams fill the report with platitudes or skip steps. For example, D4 (root cause analysis) is sometimes done inadequately, which means that the corrective action chosen is ineffective. It takes a culture of quality to implement 8D conscientiously.
- Not 100% consistent with CAPA requirements: Interestingly, there are slight differences between the classic 8D process and regulatory expectations. For example, 8D requires verification of the correction before implementation (step D5->D6), while FDA/ISO require verification of effectiveness after implementation. This means that those who work strictly according to 8D must also ensure that they comply with the formal CAPA requirements (e.g., 21 CFR 820.100). In practice, however, this can be easily aligned by interpreting the 8D process accordingly.
Example (medical technology): A catheter manufacturer is receiving an increasing number of customer complaints because some of their products are leaking. The company initiates an 8D process. D1: A team is formed consisting of a quality engineer, a process engineer, a materials expert, and a sales representative. D2: The problem is described: “20% of the catheters in batches X and Y fail the leak test and leak at the connection piece.” D3: Immediate action is taken. The affected batches are blocked, and customers receive replacements from other batches. A 100% check is introduced for current production to ensure that no leaky products are delivered. D4: Root Cause Analysis: An Ishikawa diagram and the “5-Whys” method reveal that a new adhesive mixture was used. Apparently, its viscosity is incompatible with the automatic dosing system, resulting in insufficient adhesive application and a leaking connection piece. D5: Corrective measures: Production switched back to the old adhesive, and the dosing system was adjusted. Process parameters were optimized, and an additional online leak test was installed. D6: Effectiveness Test – After implementing the measures, several batches were produced and fully tested, and no leaks were found. Even after three months, the complaint rate dropped to zero. D7: Prevention – The team documents what it has learned: more thorough validation and adhesive testing when changing materials in the future, as well as the inclusion of a specific test procedure for adhesive application in the maintenance plan. These changes are incorporated into the QM system. D8: Recognize the team: The members are thanked for their efforts, and the results are presented at the next quality meeting. This 8D report is submitted to the OEM customer and, if necessary, to the authorities to demonstrate that: We have solved the problem comprehensively. The 8D method enabled the manufacturer to address the quality problem in a structured, traceable, and successful manner, eliminating it permanently.
Anticipatory Failure Determination (AFD) – The other Way around to the Core
The AFD technique is an innovative problem-solving method based on the TRIZ approach. It takes an unusual perspective: “Reverse thinking,” or adopting the perspective of a saboteur. Rather than asking, “Why did the error occur?” you ask, “How could I deliberately cause this exact error?” This approach generates unusual hypotheses about the causes of errors, especially in the case of complex or long-standing problems. AFD helps uncover hidden causes of errors and prevent errors in new developments. The method is relatively new and is well known in the automotive industry, but it is gaining attention in other fields as well. In medical technology, for example, AFD could be used when a device exhibits a difficult-to-explain fault pattern that cannot be found using normal analyses. Here, one could try thinking creatively and destructively. Similarly, AFD can help identify potential misuse or misapplication of products early on by deliberately playing through “sabotage scenarios.”.

Advantages:
- Find unorthodox causes: The saboteur perspective encourages your team to think “outside the box.” This allows you to discover causes that would otherwise be overlooked because “no one would do that on purpose.” This shift in thinking can lead to a breakthrough, especially when dealing with complex problems that stubbornly resist any solution.
- Combines cause analysis with prevention: By considering how a mistake can be provoked, you simultaneously identify system weaknesses that can be improved. This approach is therefore doubly useful, serving both error clarification and error prevention.
- Stimulates creativity and team spirit: AFD workshops can be playful – you can play the role of an “evil genius.” This can take the frustration out of deadlocked problem analysis and motivate the team to think outside the box. It also promotes a deep understanding of the system because you consciously try to break the product down.
Disadvantages / Limitations:
- Requires TRIZ expertise: The AFD method originates from TRIZ (the Theory of Inventive Problem Solving). Not everyone is familiar with these types of creative techniques. Initial coaching may be necessary to help the team embrace “reverse thinking” and understand the approach.
- Risk of unreality: Some brainstormed ideas can seem contrived. After brainstorming, the results must be critically evaluated. Is the idea realistic or just theoretical? There is a risk of spending time on misguided paths. Maintaining a balance between creativity and facts is important.
- Still not very widespread: Since AFD is not standard in regulated industries, there is often a lack of organizational support. A quality manager may have to convince others that this method should be used. AFD documentation is not as well-established as 8D reports, for example. The findings must then be transferred to classic CAPA documents.
Example (medical technology): A new laboratory analysis device occasionally produces extreme outlier results that no one can explain. The team tries AFD: “How could we deliberately produce such incorrect results?” A saboteur on the team suggests, “I would place a strong magnetic source next to the device without anyone noticing to interfere with the sensors.” This gives the engineers the idea that electromagnetic interference fields could be playing a role. Other sabotage ideas include: “Contaminate the sample” or “drastically change the temperature.” Tests reveal that the laboratory environment (directly next to a large cooling system) generates magnetic interference fields. Normally, no one would have suspected that the EMC-tested device would be affected by this, but the combination was unfavorable at this particular laboratory location. Ultimately, AFD discovered that electromagnetic interference was the cause. The solution is to shield the device better and reposition it in the laboratory. This example illustrates how “negative thinking” can lead to discovering an unknown cause that might not be found through a standard search.
Summary
In conclusion, quality methods and root cause analysis tools are essential for medical technology companies. General quality management (QM) methods, such as failure mode and effects analysis (FMEA), statistical process control (SPC), and quality function deployment (QFD), help plan and monitor quality from the outset. Root cause analysis methods, such as the 5 Whys, Ishikawa, and 8D, ensure you learn systematically from mistakes and find permanent solutions. Many of these methods complement each other — there is no single panacea. The key is choosing the right method at the right time and applying it consistently. This will allow you to meet standard requirements (ISO 13485/FDA QSR) for effective quality management and create real added value: safe, reliable medical devices and stable processes that you and your customers can trust.